

The real question isn't whether an ad appeared on screen. It's whether a human being paid attention to it.
This article covers what attention metrics are, why traditional measurement falls short, how attention is actually measured, and what media buyers need to know to apply these insights without falling into the most common traps.
Key Takeaways
- Attention metrics measure cognitive and visual engagement with an ad, going beyond whether it simply loaded on screen
- They emerged around 2015 as a direct response to viewability's limitations
- Three measurement approaches exist: biometric tracking, behavioral data signals, and survey/cognitive methods
- Active and passive attention serve different campaign goals; treating them as interchangeable skews optimization decisions
- Optimizing for raw attention duration can backfire — probability scores tied to media quality are a more dependable signal
- Channel context matters: low-clutter, high-intent environments deliver stronger attention quality
What Attention Metrics Mean in Advertising
Attention metrics measure whether a consumer's cognitive or visual focus actually engaged with an advertisement — not just whether the ad technically appeared on screen.
The category took root around 2015, according to Adelaide Metrics, as researchers noticed that campaigns capturing more consumer attention consistently drove better outcomes across the funnel, from awareness to conversion. The IAB and MRC formalized this work further, releasing Version 1.0 of their Attention Measurement Guidelines in November 2025.
That standardization matters because attention is more complex than a single score — and misreading it leads to real budget waste.
Attention Is Not One Number
It's actually a product of three interacting inputs:
- Media quality — the placement environment, ad clutter, page geometry, above-the-fold position
- Creative relevance — whether the ad's content resonates with the audience in context
- Audience characteristics — demographics, prior brand familiarity, intent level
Optimize any one of these in isolation and the picture skews. A brilliant creative in a cluttered, low-intent environment won't perform — and a premium placement carrying an irrelevant message won't either.
From Proxy to Precision
Attention metrics exist on a spectrum:
- Loose proxies: viewability, time-in-view, scroll depth
- Mid-range signals: dwell time, cursor location, completion rates, ad-clutter scores
- Precise measures: eye-tracking data, probability-of-attention scores derived from machine learning models processing dozens of signals simultaneously
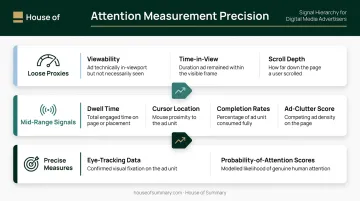
Each tier is designed to answer the same question: did this impression create a cognitive moment strong enough to influence brand recall, purchase intent, or downstream conversion.
Why Traditional Metrics No Longer Tell the Full Story
The standard measurement stack — impressions, viewability, CTR, reach, and frequency — measures exposure opportunities and surface actions. None of it confirms mental engagement.
The Limitations of Each Metric
| Metric | What it measures | What it misses |
|---|---|---|
| Impressions | Ad was served | Whether a human saw it |
| Viewability | ≥50% of pixels in view for ≥1 second (display) | Whether the viewer was paying attention |
| CTR | Ad was clicked | Whether non-clickers absorbed the message |
| Reach/Frequency | Estimated exposure count | Accuracy without third-party cookies |
The MRC's viewability standard, established in 2014, was designed as a minimum delivery threshold — not a proxy for human attention. Yet the industry treated it as the latter for a decade.
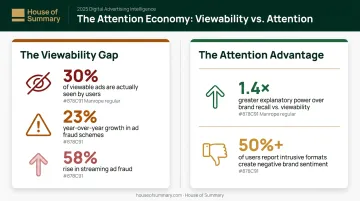
Lumen Research reports that only 30% of viewable ads are actually seen by a real person. DoubleVerify's 2024 Global Insights Report found that new fraud schemes grew 23% year-over-year and streaming fraud schemes rose 58% — meaning even "served" impressions are increasingly unreliable.
Dentsu's 2024 Attention Economy research added the clearest outcome data yet: attention had 1.4x greater explanatory power over brand recall than traditional viewability alone.
That brand recall gap has a flip side. Tactics that artificially inflate viewability — large intrusive formats, interstitials, forced-exposure placements — often reduce actual attention while generating negative brand sentiment. More than 50% of users told Nielsen Norman Group that pop-up ads affected their opinion of the advertiser "very negatively."
How Attention Is Measured: Three Key Approaches
The IAB and MRC recognize multiple methods for capturing attention data, each with different precision, scalability, and privacy implications. Most vendors combine signals rather than relying on a single approach.
Biometric and Physiological Tracking
This includes eye-tracking (gaze direction and duration), facial coding, heart rate variability, and neurological scanning. These methods provide the deepest view into subconscious engagement — when eyes actually land on an ad and how long they stay.
Practical limitations include:
- Requires specialized hardware or opt-in panels
- Difficult to scale to real-world audiences
- Biometric data is classified as sensitive personal data under GDPR Article 9, creating significant compliance obligations in Europe and under state-level US privacy laws
Behavioral Data Signals
Unlike biometric methods, behavioral tracking scales to real audiences. Signals are collected passively through existing device and publisher infrastructure:
- Dwell time and scroll speed
- Cursor location and interaction events
- Ad size, page ad count, above-the-fold position
- Active browser tab status
- Video completion rates
- Time-in-view
DoubleVerify's Authentic Attention metric analyzes 50+ data points without relying on cookies. Adelaide's AU metric uses non-identifiable behavioral signals alongside consented eye-tracking studies, making it compatible with cookieless environments.
Standardization remains inconsistent across platforms. Walled gardens and emerging channels like CTV and podcasts present data access challenges. Fast-forwarding through a video doesn't always signal disengagement, either — context matters.
Cognitive and Survey-Based Methods
These methods capture the psychological impact of an ad after exposure:
- Brand lift studies
- Recall surveys
- Purchase intent measurement
- Focus groups
They're valuable for understanding downstream brand effects. The limitation: they rely on self-reported data and can't easily be tied to specific impressions, which makes real-time optimization impractical.
Active vs. Passive Attention and the Duration Trap
Defining the Distinction
Active attention is intentional, focused engagement — a user watching a pre-roll ad with full screen concentration. Passive attention is ambient awareness — an ad heard in the background while multitasking.
Both have legitimate value, but they serve different objectives:
- Active attention is more effective for new product messaging and brand consideration
- Passive attention suits ongoing brand reinforcement with familiar products
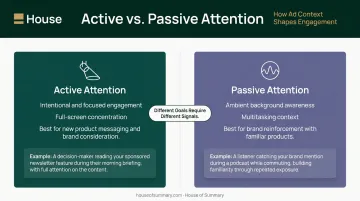
Treating them as interchangeable distorts performance data and leads to misallocated spend.
Why Duration Alone Misleads
Early attention metrics focused on seconds of exposure. Intuitive — but problematic. Duration is influenced by factors unrelated to media quality:
- Older audiences with established routines tend to dwell longer
- Users with existing brand familiarity re-engage more readily
- Emotionally provocative creative inflates duration scores regardless of placement quality
Adelaide calls this the "Attentive Audience Paradox": campaigns optimized purely for attention duration over-index toward already-converted audiences and sensational creative, producing impressive-looking scores that don't reflect genuine new-audience reach.
Playground XYZ's research on "Optimal Attention" reinforces this — the goal isn't maximum attention seconds, it's the minimum effective attention needed for a specific outcome. That threshold varies by creative and campaign objective.
A More Reliable Target
These limitations point toward a more defensible metric: probability of attention tied to media quality. Unlike duration, this measure isolates a placement's inherent ability to capture attention, independent of audience demographics or creative manipulation.
That distinction matters for two reasons:
- It better predicts full-funnel outcomes from awareness through conversion
- It's far harder to game with sensational creative or demographically skewed targeting
Applying Attention Metrics in Media Buying
Starting Points for Integration
Don't replace existing KPIs immediately. Instead:
- Layer attention data alongside existing metrics — run both in parallel to understand the relationship before weighting decisions
- Use attention scores to compare placements cross-channel : especially valuable in multi-channel campaigns where each channel traditionally uses different success metrics
- Evaluate vendor methodology carefully : look for cookieless signal-based approaches with transparent model documentation; don't assume all attention vendors are privacy-safe without documentation
- Watch for IAB standardization : the November 2025 guidelines provide a framework, but no universal currency exists yet. Comparing scores across different vendor systems is not equivalent
Channel-Level Attention Quality
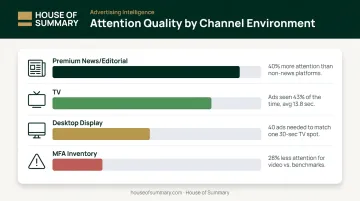
Attention quality varies significantly by environment:
- Premium news/editorial: Newsworks and Lumen found display ads on trusted news sites attract 40% more attention than non-news platforms
- TV: Ads are actually looked at 43% of the time for an average of 13.8 seconds per ad
- Desktop display: Roughly 40 display ads are needed to generate the same attention as a single 30-second TV spot
- MFA inventory: Made-for-advertising sites drove 28% less attention for video versus benchmarks — despite often appearing viewable
Low-clutter, high-intent environments consistently outperform high-volume, algorithmically driven feeds on attention quality. Channels where users have actively opted into content — like newsletter subscriptions — eliminate several common attention barriers at once: no ad blockers, no competing visual noise, no algorithmic interruption.
That's the structural advantage newsletter environments like House of Summary provide. Placements across Presidential Summary, Geopolitical Summary, Dubai Summary, and London Summary reach 500,000+ subscribers with 254,866+ emails opened daily — inside the reading flow of editorially verified content, with no blocking or visual clutter competing for attention.
The results are measurable. BSH Hausgeräte's campaign on Dubai Summary delivered click-through rates 4x higher than Google AdWords, an outcome the brand attributed directly to editorial alignment with high-intent readers.
Common Misinterpretations to Avoid
Three patterns consistently distort how attention data gets used in practice.
1. Treating Viewability as an Attention Proxy
Viewability confirms an ad had the chance to be seen — nothing more. With only 30% of viewable ads actually seen by a human, optimizing to viewability alone leaves substantial waste undetected.
2. Assuming High Attention Scores Mean Campaign Effectiveness
Attention is necessary, but not sufficient. Purchase intent also depends on price, motivation, quality, audience needs, and brand reputation — factors that don't appear in any attention score. Chasing attention metrics without controlling for creative relevance and audience fit produces impressive dashboards and underwhelming results.
3. Applying Attention Norms Across Channels Without Adjustment
A dwell-time threshold that signals strong engagement for a display ad means something entirely different for a podcast pre-roll or an in-feed social unit. Lumen, DoubleVerify, and Newsworks data show large benchmark differences across TV, social, display, in-app video, and editorial environments. Context-specific norms are essential for meaningful comparison.
Frequently Asked Questions
What is the difference between attention metrics and viewability?
Viewability confirms an ad had the technical opportunity to be seen : at least 50% of pixels were in view for at least one second. Attention metrics measure whether a real user actually engaged with it, drawing on signals including placement position, ad clutter, time-in-view, and behavioral cues. Attention is a significantly stronger predictor of brand recall and downstream outcomes.
What is the difference between active and passive attention in advertising?
Active attention is intentional, focused engagement (a user watching a video ad with full concentration); passive attention is ambient awareness, such as an ad heard while multitasking. Active attention drives stronger results for new product messaging, while passive attention supports brand reinforcement — treating them as equivalent in campaign optimization produces skewed results.
Are attention metrics standardized across the advertising industry?
No universal standard currently exists. The IAB and MRC released Version 1.0 of their Attention Measurement Guidelines in November 2025, providing a common framework for reporting and vendor disclosure — but scores across vendor systems are not interchangeable.
Can attention metrics function without third-party cookies?
Behavioral signal-based attention metrics don't rely on cookies or device IDs. They use page-level and placement-level signals collected through JavaScript tags and publisher data, making them viable in a post-cookie environment. Verify this with any specific vendor before assuming compliance.
Which advertising channels tend to deliver the highest quality attention?
Channels with lower ad clutter, higher content relevance, and intentional user behavior — including premium editorial environments, email newsletters, and connected TV — consistently produce stronger attention quality. Highly fragmented, algorithm-driven environments like social feeds tend to deliver shorter and more interrupted attention per ad.
How should a media buyer start incorporating attention metrics?
Layer attention data alongside existing KPIs rather than replacing them immediately. Use attention scores to benchmark placements across channels, prioritize vendors with transparent cookieless methodologies, and apply channel-specific norms when interpreting results.