

Introduction
Every day, advertisers pour budgets into campaigns that rack up thousands of impressions but generate little meaningful interaction. The problem isn't visibility—it's engagement. An ad can appear on a million screens and still fail to move a single viewer to act. Impressions measure exposure, but engagement reveals whether your creative actually connects.
Research shows that contextually relevant ads are noticed 60% faster than mismatched placements, and native ads drive 53% more visual attention than standard banners. Yet many campaigns still optimize for reach alone, missing the signals that separate wasted spend from real ROI.
What follows is a practical breakdown of the metrics that actually matter, what drives them, and how to improve them across display, video, and newsletter campaigns.
Key Takeaways
- Ad engagement tracks user interactions beyond impressions—clicks, video views, hover time, and more
- Core metrics include CTR, engagement rate, viewability, dwell time, and video completion rate
- Engagement depends on ad relevance, creative quality, placement environment, and technical performance
- Higher engagement comes from precise targeting, strong creative, and channels built for interaction
What Is Ad Engagement?
The Interactive Advertising Bureau (IAB) defines ad engagement as "a spectrum of consumer advertising activities and experiences—cognitive, emotional, and physical—that will have a positive impact on a Brand". This definition deliberately moves beyond simple clicks, recognising that engagement encompasses a range of behaviours that signal attention and interest.
Engagement differs fundamentally from impressions. An impression confirms an ad was delivered; engagement confirms a user responded. The IAB explicitly notes that "clicks are not the only indication of Engagement, nor the 'best' indication of Engagement, nor appropriate in every use case." This distinction matters because high impressions with low engagement often indicate poor creative-audience fit, wasted budget, or ineffective placement.
Why Engagement Matters More Than Reach Alone
High engagement signals that your creative resonates with the audience, supports brand recall, and correlates with meaningful ROI—not just ad spend activity. Engagement metrics sit between awareness (impressions) and conversion (sales or sign-ups), acting as a diagnostic layer that reveals whether your campaign is actually working or simply being seen.
Advertisers who optimise only for impressions discover that visibility doesn't translate to business outcomes. A campaign with high impressions but low CTR usually points to one of three causes:
- Wrong audience — the targeting reaches people outside your buyer profile
- Weak creative — the message or visual fails to earn attention in context
- Poor placement — the ad appears where users are not in a receptive mindset
Lower reach with strong engagement, by contrast, typically delivers better cost-per-acquisition and more durable brand recognition.
Key Ad Engagement Metrics to Track
Not all metrics reveal the same thing. Tracking the right combination gives a fuller picture of campaign health than any single data point. The metrics below form the foundation of effective engagement measurement.
Clicks and Click-Through Rate (CTR)
CTR measures the percentage of impressions that result in a click, calculated as:
CTR = (Clicks ÷ Impressions) × 100
According to WordStream's 2025 benchmarks, the average CTR for standard display ads on the Google Display Network is 0.46%. CTR is useful for benchmarking performance across campaigns and identifying which creatives or placements generate the most direct response.
CTR has limitations, though. It doesn't capture non-click interactions — users who watch a video, hover over an ad, or remember your brand without clicking. A low CTR doesn't necessarily mean low engagement if other interaction signals are strong.
Engagement Rate
Engagement rate combines multiple interaction types—clicks, hovers, scroll depth, video views—divided by total impressions. There is no universal formula; the components vary by platform and ad format.
General formula:
Engagement Rate = (Total Engagements ÷ Total Impressions) × 100
Platform-specific examples:
- Video ads: (Views + Clicks + Completed Views) ÷ Impressions
- Display ads: (Clicks + Hover Time + Scroll Depth) ÷ Impressions
- Email/Newsletter: According to Mailchimp's 2023 benchmarks, the average click rate is 2.62% (total clicks ÷ delivered emails)
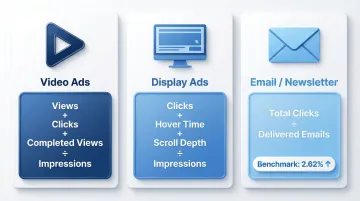
Engagement rate provides a more holistic view than CTR alone, especially for formats where non-click interactions indicate interest.
Viewability and Dwell Time
Viewability establishes whether an ad had the opportunity to be seen. The Media Rating Council (MRC) standard defines a viewable impression as:
- Display ads: 50% of pixels visible for at least 1 second
- Video ads: 50% of pixels visible for at least 2 seconds
DoubleVerify's 2023 Global Insights Report found that overall display viewability is 69%, but "Authentic Viewability" (viewable, fraud-free, brand-suitable, in-geo) drops to 66%. Without verification filters, viewability falls to 59% for display and 53% for video.
Meeting the MRC viewability standard confirms an ad could be seen — it doesn't confirm anyone actually looked at it. Viewability sets the floor for measurement, not the ceiling.
Dwell time measures how long a user actively views or hovers over an ad. Integral Ad Science reports that the global average time-in-view was 15.78 seconds in the second half of 2023. Dwell time is a richer quality signal than viewability alone—it indicates sustained attention, not just passive exposure.
Video Completion Rate and Interaction Rate
Video Completion Rate (VCR) tracks the percentage of video ads watched to the end. It signals strong creative relevance and storytelling effectiveness. DoubleVerify's data shows:
- Connected TV (CTV): 96% average VCR
- Mobile/Desktop: 67% average VCR
CTV environments command significantly higher attention and completion rates due to larger screens, fewer distractions, and lean-back viewing behavior.
Interaction rate measures the percentage of impressions that triggered a deliberate user action—hover, swipe, expand, drag, or click. High interaction with low conversion typically points to strong creative paired with a weak landing page or unclear CTA — fixing the post-click experience often moves the needle more than refining the ad itself.
Active vs. Passive Engagement: Why Both Matter
Active engagement includes deliberate, measurable user actions:
- Clicks
- Form submissions
- Shares or comments
- Video replays
These signal high intent and are the most direct proof of audience interest.
Passive engagement captures less explicit but still valuable signals:
- Video views (without interaction)
- Hover-overs
- Scroll depth
- Time spent on page
Passive engagement often precedes active engagement—it's early-stage consideration. For example, a reader who spends 45 seconds on a page containing your ad but never clicks is still demonstrating interest that can be leveraged for retargeting.
Tracking only clicks leaves most of that signal on the table. A user who watches 80% of your video ad or hovers over your display creative for 10 seconds is engaged — and that behavior shapes smarter retargeting, better creative decisions, and more accurate campaign reporting. Measuring both types together gives you a far clearer read on what's actually working.
What Influences Ad Engagement?
Ad Relevance and Audience Targeting
Contextually relevant ads—matched to the content environment or audience segment—consistently outperform generic placements. Precise targeting based on user behaviour, demographics, or content context reduces wasted impressions and increases meaningful interaction.
An eye-tracking study by Integral Ad Science and Tobii found that contextually relevant ads are noticed 60% faster (0.4 seconds vs 1.0 second) than out-of-context ads. The same study revealed that purchase intent was 14% higher among consumers who viewed in-context ads, alongside a 5% increase in brand favourability.
Takeaway: Precision targeting based on content relevance or user behaviour signals dramatically improves engagement quality.
Creative Quality and Format
High-quality visuals, clear messaging, and interactive elements increase the likelihood of engagement. The ad format also matters significantly.
Research by Sharethrough and IPG Media Lab found that consumers looked at native ads 53% more frequently than display ads. Native ads also registered an 18% higher lift in purchase intent and a 9% lift in brand affinity compared to standard banner ads.
Key insight: Native ads, which match the form and function of surrounding editorial content, drive substantially higher engagement than standard banners because they feel less intrusive and more relevant.
Channel Selection and Placement Environment
Where an ad appears shapes the quality of attention it receives. Social feeds, search results, display networks, and newsletter inboxes each deliver different engagement dynamics.
Newsletter advertising eliminates two key engagement killers:
- Algorithmic suppression: Newsletters deliver directly to inboxes without algorithms filtering visibility
- Ad blockers: Email-based ads bypass browser-based ad blocking entirely
This gives brands direct, uninterrupted access to readers in an active reading mindset rather than a passive scroll. House of Summary's newsletter placements, for example, deliver CTRs 4x higher than Google AdWords benchmarks, reaching a high-intent audience with no visual clutter or competing distractions.
Page Speed and Technical Performance
Slow-loading ads damage engagement before users even have the chance to interact. The data on load time thresholds is stark:
- 53% of mobile visitors abandon a page that takes longer than 3 seconds to load
- A 100-millisecond delay can cut conversion rates by up to 7%
- A 2-second delay pushes bounce rates up by as much as 103%
- Sites loading within 5 seconds see 25% higher ad viewability and 70% longer average sessions than those taking 19 seconds
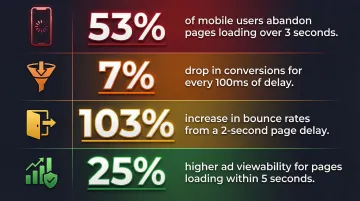
Technical performance directly affects whether an ad gets seen at all.
Strategies to Improve Ad Engagement
Sharpen Your Targeting Before You Launch
Define specific audience segments based on intent signals, content affinity, or behavioural data. The more precisely an ad matches the reader's context, the more naturally it invites interaction.
Action steps:
- Use behavioural signals (recent site visits, content consumption patterns) to refine targeting
- Segment by content context (in-market buyers vs. researchers vs. brand-aware audiences)
- Avoid broad targeting that produces high impressions but shallow engagement
Invest in Creative That Earns Attention
The first frame, headline, or subject line determines whether a user pauses or scrolls. Design for the environment—mobile-first gestures, clear interaction cues, and visual hooks that arrest attention within the first few seconds.
Progressive disclosure: Layer information for curious users without overwhelming at first glance. Start with a bold visual or headline, then reveal detail for users who hover or interact.
Best practices:
- Use high-contrast visuals that stand out without feeling intrusive
- Write headlines that promise clear value or solve a specific problem
- Include a single, unmistakable call-to-action (don't offer multiple paths)
Choose Channels Based on Engagement Quality, Not Just Reach
A smaller, highly engaged audience consistently delivers better ROI than a large but disengaged one. Evaluate channel performance by engagement rate and CTR alongside reach.
Newsletter advertising is a channel built for engagement:
- Reaches inboxes directly — no algorithms filtering content, no ad blockers intercepting delivery
- Captures readers in an active reading mindset, not a passive scroll
- Delivers click-through rates that can run 4x higher than search advertising
This makes newsletter placements a natural fit for brands in finance, luxury, and global business targeting high-intent audiences who expect quality and relevance.
Test, Measure, and Iterate
Use A/B testing on headlines, visuals, CTAs, and placement positions to identify what drives higher interaction. Track engagement metrics across the campaign flight, not just at the end. Early signals like dwell time and interaction rate can inform mid-campaign creative rotation before budget is wasted.
What to test:
- Headline variations (benefit-driven vs. curiosity-driven)
- Visual style (lifestyle imagery vs. product-focused)
- CTA placement and language
- Ad format (native vs. display vs. video)
Read Engagement Metrics in Context
Combine engagement data with conversion and revenue data for the full picture:
- High engagement + low conversion = strong creative, weak CTA or landing page
- Low engagement + strong conversion = small but high-intent audience
- High engagement + high conversion = optimal creative-audience alignment
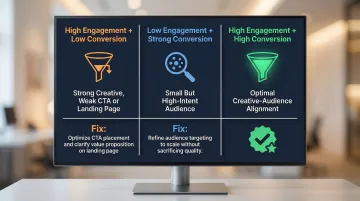
Each pattern points to a specific fix. Engagement metrics don't just measure performance — they show exactly where the funnel needs attention.
Frequently Asked Questions
What does the engagement metric measure in your ads dashboard?
Engagement metrics track how users interact with ads beyond impressions—including clicks, video views, expansions, and time spent. Platforms like Google Ads measure format-specific actions such as expanding a lightbox or watching a video for 10+ seconds.
What are good engagement metrics?
The most meaningful engagement metrics are CTR, engagement rate, dwell time, video completion rate, and interaction rate. The best metrics to prioritise depend on the ad format and campaign objective—video campaigns should prioritise VCR, while display campaigns focus on interaction rate and dwell time.
What is a good engagement rate for ads?
Benchmarks vary by format and platform. Standard display ads average 0.46% CTR, whilst native ads typically achieve 0.30% to 0.70%. Email/newsletter click rates average 2.30% to 2.62%. Evaluate your performance against format-specific benchmarks rather than a single universal standard.
Is a 2.5 ROAS good?
ROAS (Return on Ad Spend) measures revenue generated per pound of ad spend. A 2.5x ROAS means £2.50 returned per £1 spent. Whether this is "good" depends on the industry, profit margins, and campaign goals—some sectors require 4x+ to be profitable after factoring in operating costs.
What are the 5 marketing metrics?
The five core marketing metrics are impressions (awareness), CTR (interest), engagement rate (interaction quality), conversion rate (action), and ROAS (revenue). Together, they span the full funnel from awareness through to measurable outcomes.