

Introduction
Advertising budgets grew by 7.3% in 2024, digital channels now outnumber traditional media by a factor of five, yet most marketing directors can't definitively answer a basic question: what did our ads actually achieve? This disconnect is widespread. Marketers track everything but measure nothing meaningful — collecting data without connecting it to real business outcomes.
This guide breaks down the ad performance metrics worth tracking, how to interpret them correctly, and how to build a measurement framework that connects every dollar spent to results you can defend in a boardroom.
Key Takeaways
- Ad performance metrics are measurable data points showing whether advertising works and where budgets deliver strongest returns
- Metrics align to funnel stages: awareness (impressions, CPM), engagement (CTR, CPC), and conversion (CPA, ROAS)
- Matching metrics to campaign goals prevents misleading results and wasted spend
- Follow this measurement process: define goal → select metrics → implement tracking → interpret data → optimize
- Newsletter advertising delivers cleaner metric signals than web display due to zero ad blockers and no algorithmic interference
What Are Ad Performance Metrics?
Ad performance metrics are quantifiable data points used to evaluate advertising campaign effectiveness, measuring everything from initial ad exposure to final conversions. These metrics answer critical questions: How many people saw the ad? How many engaged? How many completed the desired action?
The right metrics depend entirely on campaign objectives. A brand awareness campaign measured by cost per acquisition (CPA) will appear to fail; a direct response campaign judged only by impressions misses the point entirely. Misaligned metrics distort the performance picture and lead to poor budget decisions.
Metrics split into two categories:
- Vanity metrics (impressions, followers, likes) look impressive in reports but offer limited decision-making value
- Actionable metrics (CTR, CPA, ROAS) directly inform budget allocation and creative strategy
According to the IAB, business outcomes — sales, leads, and site visits — are now the top KPI priority for buyers across all channels, with reach and frequency ranking second. That shift matters: it means the industry is moving away from measuring attention and toward measuring results.
Why Ad Performance Metrics Are Critical for Advertisers
Without tracked metrics, ad spend is guesswork. Metrics create accountability by connecting every dollar to measurable outcomes—essential when justifying spend to stakeholders or clients. The ANA's Q2 2025 Programmatic Transparency Benchmark reveals that $26.8 billion in global media value is lost annually to inefficiencies, with less than half of every programmatic dollar effectively reaching consumers.
Real-time monitoring enables mid-campaign course correction. Waiting until a campaign ends to review performance guarantees wasted budget. Advertisers using Meta's AI-enabled Advantage+ products generate an average of $4.52 in revenue for every dollar spent—a 22% increase compared to business-as-usual campaigns. Similarly, Google's AI Max for Search campaigns deliver a 20% lift in incremental conversions and 22% lower CPA through automated optimization.
Those performance gains only materialize when advertisers act on the data. Metrics enable smarter budget allocation by making channel-by-channel comparisons concrete:
- Identifies which placements generate the strongest ROI
- Redirects spend away from underperforming channels in real time
- Compounds returns over time instead of spreading budgets thin
The Core Ad Performance Metrics Every Advertiser Should Know
Awareness and Reach Metrics
Impressions and CPM:
Impressions count total ad displays—a foundational awareness signal. Cost Per Mille (CPM) measures the cost per 1,000 impressions.
Formula: CPM = (Total Ad Spend ÷ Impressions) × 1,000
A $10 CPM means the advertiser pays $10 for every 1,000 ad views. CPM suits brand awareness campaigns prioritizing reach and visibility over immediate action.
2026 CPM Benchmarks:
- Meta Ads: $14.19 median (20% YoY increase)
- LinkedIn B2B: $40.18 median
- Programmatic Display: $3.50 average
Reach and Frequency:
Reach counts unique users exposed to the ad. Frequency measures how many times the same user sees it. These metrics work together—high frequency with low reach indicates ad fatigue, while high reach with low frequency suggests insufficient message reinforcement.
Ad fatigue thresholds:
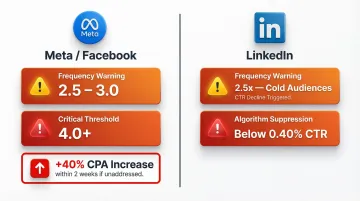
- Meta/Facebook: Frequency above 2.5–3.0 signals danger; above 4.0 is critical
- Meta/Facebook: Unaddressed fatigue increases CPA by 40% within two weeks
- LinkedIn: Frequency above 2.5x on cold audiences triggers CTR decline
- LinkedIn: Algorithm suppresses delivery when CTR drops below 0.40%
Engagement and Traffic Metrics
Click-Through Rate (CTR):
CTR measures the percentage of people who clicked after seeing the ad.
Formula: (Clicks ÷ Impressions) × 100
CTR indicates creative relevance and audience alignment.
2026 CTR Benchmarks:
- Google Search: 6.66% median
- Google Display: 0.46% average
- Meta Ads: 2.19% median
- LinkedIn: 0.69% median
Cost Per Click (CPC):
CPC shows the average cost paid per click.
Formula: Total Ad Spend ÷ Total Clicks
2026 CPC Benchmarks:
- Google Search: $5.26 median
- Google Display: $0.63 average
- Meta Ads: $1.92 median (Lead Ads)
- LinkedIn: $5.53 median
A high CPC alongside low CTR signals targeting or creative problems requiring immediate fixes. Google's Ad Rank system incorporates expected CTR and ad relevance into CPC calculations—higher quality ads earn lower CPCs.
Bounce Rate:
Bounce rate measures the percentage of users who land on a page after clicking but leave without taking action. In Google Analytics 4, bounce rate is the inverse of engagement rate.
Bounce Rate Benchmarks for Paid Traffic:
- Paid Search: ~44%
- Display Ads: ~56.5%
- Paid Social: ~54%
High bounce rates point to disconnects between ad promise and landing page experience, making this a diagnostic metric rather than a pure performance indicator.
Conversion and ROI Metrics
Conversion Rate and Cost Per Acquisition (CPA):
Conversion Rate measures how effectively clicks become actions.
Formula: (Conversions ÷ Clicks) × 100
CPA shows the average cost of each conversion.
Formula: Ad Spend ÷ Conversions
2026 Conversion Rate and CPA Benchmarks:
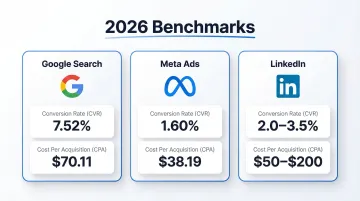
| Channel | CVR | CPA |
|---|---|---|
| Google Search | 7.52% | $70.11 |
| Meta Ads | 1.60% | $38.19 |
| 2.0–3.5% | $50–$200 |
When bounce rates are high and conversions low, the gap usually lives between the ad click and the landing page — not in the targeting itself.
Return on Ad Spend (ROAS) vs. Return on Investment (ROI):
ROAS measures revenue generated per dollar of ad spend, evaluating campaign-level financial performance.
Formula: ROAS = Revenue ÷ Ad Spend
ROI is broader, incorporating all business costs.
Formula: ROI = (Revenue - Cost of Goods Sold) ÷ Cost of Goods Sold
Rule of thumb: Use ROAS for channel and campaign decisions; use ROI for overall business profitability.
2026 B2B ROAS Benchmarks:
- LinkedIn: 121% (the only platform with positive average ROAS)
- Google Search: 67%
- Meta: 51%
Despite LinkedIn's higher CPCs, it outperforms all platforms on revenue impact for B2B marketers.
CPM vs. CPC—which is better? Neither is universally superior. CPM suits awareness objectives where reach and visibility matter most. CPC suits traffic and performance campaigns where paying only for clicks aligns with the objective.
How to Measure Ad Performance Step by Step
Effective measurement is a repeatable process — one that starts before launch, not after. The most common mistake is selecting metrics once the campaign is already running, which produces data you can't act on. According to the IAB's State of Data 2026 report, 75% of marketers admit their measurement systems are broken, with 0% reporting that their Marketing Mix Models cover all paid channels accurately.
Step 1 – Define the Campaign Goal
Determine the single primary objective before selecting any metric: Is this campaign designed to build awareness, drive traffic, generate leads, or produce direct sales?
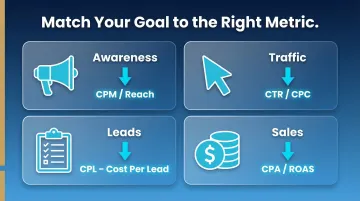
Each goal maps to different primary metrics:
- Awareness → CPM/Reach
- Traffic → CTR/CPC
- Leads → CPL (Cost Per Lead)
- Sales → CPA/ROAS
Without a defined goal, every metric looks equally relevant — and none of them drive decisions.
Step 2 – Select and Prioritise the Right Metrics
Choose three metric types:
- Primary metric - Directly measures goal achievement
- Secondary metric - Provides context
- Diagnostic metric - Flags problems
Example for a sales campaign:
- Primary: ROAS
- Secondary: Conversion Rate
- Diagnostic: Bounce Rate
Keeping the list short forces focus — too many metrics diffuse accountability.
Step 3 – Set Up Tracking and Establish Baselines
Ensure tracking mechanisms are in place before launch: conversion pixels, UTM parameters, or platform-native analytics. Two issues account for most data loss here:
- Broken pixels — cause up to 40% of data loss in live implementations
- UTM misconfigurations — typos or missing source parameters break credit assignment entirely
Without a baseline, there's no meaningful benchmark for improvement. Establish what "normal" looks like before launching so significant deviations are immediately visible.
Step 4 – Monitor, Interpret, and Diagnose Results
Read results in context — a low CTR on a display ad means something different from a low CTR in a newsletter.
Look for patterns:
- Falling CTR over time = creative fatigue
- Rising CPC with stable CTR = increased competition
- High impressions with low CTR = audience misalignment
- High CTR with high bounce rate = landing page disconnect
Step 5 – Optimise and Iterate
Use findings to make targeted adjustments:
- Low CTR → Change creative
- High CPA → Refine targeting
- Bounce rate spikes → Review landing page
- Ad fatigue → Refresh creative or reduce frequency
Measurement only creates value when it drives action.
How House of Summary Delivers Measurable Ad Results
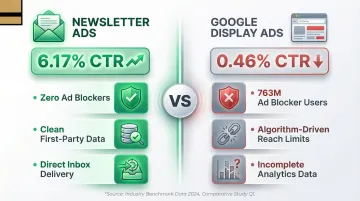
The channel where an ad runs fundamentally affects metric reliability and quality. Web display and social ads face ad blockers (763 million users worldwide), algorithm-driven reach limits, and noisy inventory that inflate impressions while suppressing real engagement. Ad blocking cost publishers $54 billion in lost revenue in 2024, representing roughly 8% of total global ad spend. Ad blockers also block analytics tags, creating incomplete data that skews display impression reliability.
Newsletter advertising bypasses all of these obstacles. Ads land directly in the inbox, are seen by readers who opened the email by choice, and produce clean, unfiltered engagement data with zero algorithmic interference.
That channel advantage is amplified by audience quality. House of Summary's network reaches global executives, business professionals, and high-intent readers who produce significantly stronger engagement than broad web display campaigns. The numbers reflect this:
- Editorial newsletters average a 6.17% CTR, compared to 0.46% for Google Display ads
- Newsletter publishers are projected to grow revenue 30% year-over-year through 2026
- Advertiser rebooking intent increased 53% year-over-year, signaling confidence in first-party audience engagement
For advertisers who take ad performance metrics seriously, the quality of metric data is as important as the quantity. A smaller, highly engaged newsletter audience often delivers stronger CPA and ROAS outcomes than a larger, disengaged web audience. With no ad blockers and no algorithmic reach restrictions, every impression House of Summary delivers is a real one.
Marketing decision makers and media buyers looking to improve campaign measurement and results can contact House of Summary's sales team at sales@houseofsummary.com to discuss campaign fit.
Frequently Asked Questions
How do you measure and track advertising performance?
Measuring ad performance starts with defining a campaign goal and selecting aligned KPIs—such as CTR, CPA, or ROAS. Set up tracking tools (pixels, UTM parameters) before launch, then review data regularly to optimize spend and creative based on what the metrics reveal.
How do you measure online advertising effectiveness?
Online advertising effectiveness is measured by comparing actual results against benchmarks across metrics like conversion rate, ROAS, and CPA. The metric that matters depends on campaign objective—awareness campaigns require different success measures than direct response campaigns.
What are common advertising performance metrics?
The most widely used metrics are CTR (engagement rate), CPM (reach cost efficiency), CPC (traffic cost), CPA (conversion cost), ROAS (revenue per ad dollar), and Conversion Rate (action rate). Each serves a different stage of the funnel from initial awareness through final conversion.
Is CPM better than CPC?
Neither is universally better. CPM is better suited to brand awareness campaigns where reach and visibility are the goal. CPC is more appropriate for traffic and performance campaigns where paying only for clicks aligns with the objective of driving qualified site visits.
What does $10 per CPM mean?
A $10 CPM means the advertiser pays $10 for every 1,000 times their ad is displayed. This rate helps compare cost efficiency across channels and campaigns to identify which placements deliver the most affordable reach.