
The gap isn't a technology problem. The IAB Europe noted there's no industry-agreed standardized method for measuring native formats, even as campaign adoption grew 35% in a single year. That disconnect between spend growth and measurement maturity is where most native campaigns quietly lose money.
This article covers what to actually measure across native formats — in-feed placements, sponsored content, recommendation widgets, and email newsletters — how to act on that data, and how to scale once performance is confirmed.
Key Takeaways
- Match KPIs to campaign stage — awareness, consideration, and conversion each need different primary metrics
- Use a three-tier framework: delivery (viewability), engagement (CTR, dwell time, scroll depth), and outcomes (CPA, brand lift)
- Open-web native CTR benchmarks at 0.16%–0.3%; newsletter placements routinely deliver 4x higher engagement rates
- Scale only after confirming stable CPA, above-benchmark CTR, strong scroll depth, and consistent conversion signals at test budget
- Newsletter native ads bypass ad blockers entirely, making performance data more reliable than open-web tracking
The Native Advertising Analytics Framework: What to Measure and Why
Measurement fails when teams pick KPIs after launch. The right framework maps metrics to objectives upfront — because a campaign optimized for brand awareness looks very different from one optimized for lead generation, and treating them as the same produces misleading conclusions.
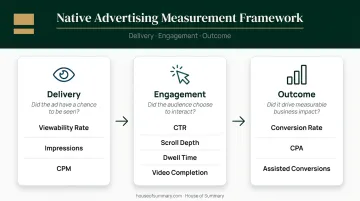
The clearest structure is a three-tier model:
- Delivery metrics — did the ad have the opportunity to be seen?
- Engagement metrics — did the audience choose to interact with it?
- Outcome metrics — did it drive business impact?
Each tier answers a different question. Using only one tier gives you an incomplete and often misleading picture.
Delivery Metrics
Viewability is the baseline. The MRC/IAB standard defines a viewable display impression as ≥50% of pixels in view for ≥1 continuous second after render; for video, that extends to ≥2 continuous seconds. Large-format display ads (242,500 pixels or larger) qualify at 30% pixels in view.
That's the floor, not the target. A viewable impression tells you the ad had the opportunity to work: nothing more. Delivery metrics justify your CPM spend; they don't validate creative performance.
Engagement Metrics
Engagement metrics — CTR, scroll depth, dwell time, video completion rate — measure whether audiences chose to do something after the ad appeared. In native specifically, CTR functions as a relevance score: it reflects how well the headline-image combination matched audience expectations, not just whether the ad was visible.
Post-click behavior matters as much as the click. If users land and exit within seconds, the creative set an expectation the destination content didn't meet.
Outcome Metrics
Conversion rate, cost per acquisition (CPA), and assisted conversions tie native activity to business results. For view-through conversions, use a conservative attribution window (1–7 days) and document your methodology explicitly. Without that, inflated numbers will face immediate pushback from finance and analytics teams reviewing the campaign.
The table below maps each tier to its core metrics and the question it answers:
| Tier | Key Metrics | Question It Answers |
|---|---|---|
| Delivery | Viewability rate, impressions, CPM | Did the ad have a chance to be seen? |
| Engagement | CTR, scroll depth, dwell time, video completion | Did the audience choose to interact? |
| Outcome | Conversion rate, CPA, assisted conversions | Did it drive measurable business impact? |
Key Metrics That Actually Move the Needle
CTR as a Relevance Score
In native environments, ads compete directly with editorial headlines. A low CTR doesn't mean the audience is wrong — it means the headline-image combination failed to signal value clearly enough.
Benchmarks by placement type:
| Format | CTR Range |
|---|---|
| Standard IAB display | ~0.12% |
| Open-web native (programmatic) | ~0.16%–0.3% |
| Premium native (smartphone, Outbrain) | Up to 0.38% |
| Email newsletter placements | Higher — LiveIntent reports 44% lift over display |
CTR alone isn't enough. Always pair it with post-click engagement data. A 0.5% CTR that leads to a 90% bounce rate is worse than a 0.2% CTR with strong scroll depth.
Dwell Time and Scroll Depth
These are the most underused signals in native analytics. Dwell time measures how long users stay with the content after clicking; scroll depth measures how far they read.
The diagnostic logic:
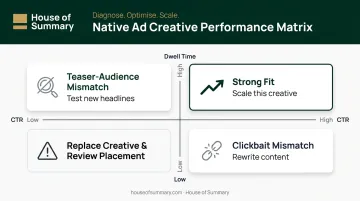
- High CTR + low dwell time = clickbait creative. The headline promised something the content didn't deliver.
- Low CTR + high dwell time = relevance mismatch. The right people are reading once they arrive, but the teaser isn't reaching them effectively.
GA4's enhanced measurement can track scrolls natively. The default scroll event fires at 90% vertical page depth — useful for measuring deep engagement but worth supplementing with Google Tag Manager triggers at 25%, 50%, and 75% for a fuller picture of drop-off points.
Attention Metrics Beyond Viewability
Viewability confirms an ad could be seen. Attention metrics measure whether it actually registered. The distinction matters: Adelaide's research found high-quality media placements with AU scores above 250 were 45% more likely to drive brand search and could generate 6x more online orders than low-AU placements.
Key attention indicators to track:
- Time the ad spent actively in the viewport (in-view duration)
- Cursor hovers, scrolls past the unit, and video play rates
- Attention quality scores from third-party providers like Adelaide, IAS, or DoubleVerify
Brand Lift and Earned Media Signals
Last-click attribution routinely misses native advertising's real contribution. Native often works on upper-funnel outcomes — awareness, favorability, purchase intent — that appear weeks later as organic search or direct traffic.
Brand lift surveys from Nielsen or Kantar measure what the dashboard can't: unaided awareness, ad recall, and purchase intent shifts between exposed and control groups. For campaigns above roughly $50K in spend, running these alongside standard analytics is standard practice — not optional.
Content shares, newsletter forwarding rates, and external links to sponsored content signal organic amplification. Each share extends reach without additional spend, lowering effective CPM and improving overall campaign efficiency.
From Data to Action: Optimizing Native Ad Campaigns
The Creative Optimization Loop
Never launch a native campaign with a single creative. Start with a portfolio of headline and image combinations — at minimum three to five variants — and let performance data guide consolidation.
Reading the signals:
| Signal | Interpretation | Action |
|---|---|---|
| High CTR + low dwell time | Clickbait mismatch | Rewrite content to match headline promise |
| Low CTR + high dwell time | Teaser-audience mismatch | Test new headlines, not new content |
| Low CTR + low dwell time | Creative and context both wrong | Replace creative and review placement |
| High CTR + high dwell time | Strong fit | Scale this creative |
Run A/B tests on a rolling two-week cadence. Pause underperformers at 500–1,000 impressions minimum; give winners more budget before drawing conclusions.
Audience and Contextual Targeting
Analytics data reveals which content categories, audience segments, and publisher contexts deliver the strongest engagement-to-conversion ratio. Use that data to reallocate budget toward higher-quality placements rather than defaulting to the largest-reach options.
Third-party cookies haven't disappeared yet — Google has held its current approach rather than issuing a new deprecation timeline — but the trajectory toward privacy-first environments is clear. In that context, section relevance, topic alignment, and semantic matching become the most durable optimization levers. They hold up where audience cookies won't.
Bid Strategy and Creative Fatigue
Match bid strategy to objective:
- CPC for traffic-focused campaigns
- CPM for brand awareness
- CPE for engagement-driven goals
Use performance data (cost per engaged session, cost per qualified click) to set bid floors and caps.
Watch for creative fatigue, especially in feed and email environments. The signal is a declining CTR over time at stable or increasing spend. When you see that pattern, the creative is wearing out, not the audience. Refresh at the point of decline, not after it's already cost you efficiency.
Landing Page as Part of the Native Stack
Strong CTR with weak scroll depth and high bounce rates means the problem isn't the ad — it's the destination. A high-performing native content landing page:
- Loads fast on mobile (under 3 seconds)
- Discloses sponsorship near the headline
- Opens with a narrative that matches the ad's promise
- Doesn't immediately pivot to a hard sell
This step gets skipped constantly. The destination page completes — or breaks — what the ad started.
How to Scale Native Advertising Campaigns
Prove It Before You Scale It
Analytics don't just tell you what's working — they tell you when you're ready to spend more. Confirm these thresholds at test budget before increasing spend:
- CPA is stable across multiple reporting periods (not just one good week)
- CTR is above the benchmark for the placement type
- Scroll depth and dwell time indicate the content is being consumed
- Brand lift signal is positive (for upper-funnel campaigns)
Only one of these needs to be primary — which one depends on your objective. But all should be trending in the right direction.
Horizontal vs. Vertical Scaling
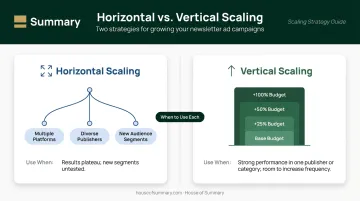
Horizontal scaling means adding new platforms, publishers, or audience segments. Vertical scaling means increasing budget within a proven placement.
| Approach | When to Use It |
|---|---|
| Horizontal | Results plateau in current placements; new audience segments untested |
| Vertical | Strong performance in one publisher or content category; room to increase frequency |
Analytics guides the choice. If results are concentrated in a specific content category or publisher context, horizontal expansion should prioritize matching that profile — not just chasing the largest available reach.
A specialized newsletter audience that converts at twice the rate of a broad open-web placement deserves vertical budget before horizontal dilution.
Incrementality Testing Before Big Budget Moves
As spend grows, correlation metrics become unreliable. A native campaign that appears to drive conversions may simply be reaching audiences who were already close to purchase. Geo-based holdout tests — comparing conversion rates in regions exposed to the campaign versus control regions — separate genuine lift from attribution coincidence.
Run holdout tests before major budget commitments. Without them, you risk scaling spend against audiences who would have converted anyway — paying more for outcomes you were already earning.
Attribution Challenges and How to Address Them
Multi-Touch Attribution in GA4
Last-click attribution systematically undervalues native advertising. A reader who sees a sponsored article on Monday, searches the brand on Thursday, and converts via a direct visit on Friday gives all credit to "direct" — erasing the native touchpoint entirely.
GA4's data-driven attribution model distributes credit across the conversion path using observed behavior rather than fixed rules. To configure it, navigate to Admin > Attribution Settings and switch the model to Data-driven. Then review the Attribution paths report to see where native placements appear in the conversion journey.
Privacy Changes and Practical Responses
That attribution clarity gets harder to maintain as signal loss compounds. Apple's AppTrackingTransparency has reduced iOS web conversion visibility — Meta reported underreporting improved from 15% to roughly 8% by early 2022, but that still represents meaningful data loss for mobile-heavy campaigns.
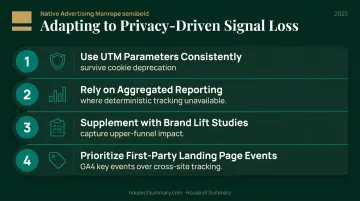
Practical responses:
- Use UTM parameters consistently across every native placement — they survive privacy changes that third-party cookies don't
- Rely on aggregated reporting where deterministic tracking is unavailable
- Supplement analytics with brand lift studies to capture upper-funnel impact that click tracking misses
- Prioritize first-party landing-page events (GA4 key events) over cross-site tracking
View-Through Attribution
Used carefully, view-through attribution is a defensible metric. A 1–7 day window is conservative and defensible; longer windows invite over-attribution. Document the methodology explicitly in your reporting — "this figure includes view-through conversions within a 3-day window" — so stakeholders can evaluate it appropriately rather than treating it as equivalent to click-based conversions.
Why Email Newsletter Native Advertising Delivers Cleaner Analytics
Open-web native ads face a measurement tax that email doesn't. The 2022 PageFair report documented 290 million desktop adblocking monthly active users globally, with an average 21% adblock rate across verticals. That's a significant slice of impressions that never register in any analytics system.
Email newsletter ads bypass this entirely. They're delivered directly to the inbox — no page render, no JavaScript dependency, no ad blocker interception. Every open, every click, every downstream conversion tied to that click is traceable through first-party data. The result is a measurement environment that open-web placements simply can't replicate.
Engagement Quality Difference
Email newsletter audiences are opt-in — they chose a specific publication because they want that content. That self-selection produces higher baseline engagement than open-web placements, where contextual targeting is an educated guess rather than a confirmed interest signal.
The CTR difference reflects this. Open-web native benchmarks around 0.16%–0.3% (IAB Europe). Email newsletter native ads, per LiveIntent, show 44% higher CTR than display ads in comparable environments. General email click rates in Media, Entertainment, and Publishing verticals average 2.9% (Campaign Monitor) (a general benchmark rather than a sponsored-placement figure, but useful for framing).
House of Summary's Analytics Advantage
House of Summary's network — Presidential Summary, Geopolitical Summary, Dubai Summary, and London Summary — reaches 500,000+ subscribers with over 254,000 emails opened daily. The audience skews toward decision-makers, executives, and high-net-worth professionals across the US, UK, and UAE.
For advertisers, this matters analytically: every click is logged against an opted-in, identified reader in a first-party data environment. UTM parameters pass through cleanly, enabling full GA4 attribution without cross-site cookie dependency. There's no ad blocker between the ad and the reader.
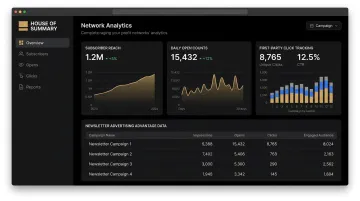
The network's claimed 4x CTR advantage over Google AdWords reflects this engagement quality gap — an engaged, topic-specific audience in a distraction-free inbox environment simply responds differently than a browser-served impression. When attribution accuracy directly affects budget decisions, that gap between what you can measure and what actually happened carries real cost.
Frequently Asked Questions
What are the most important KPIs for measuring native advertising performance?
The right KPIs depend on your campaign objective, but the framework covers three tiers: delivery (viewability — was the ad seen?), engagement (CTR, dwell time, scroll depth — was it consumed?), and outcomes (CPA, conversion rate — did it drive results?). Most campaigns should track at least one metric from each tier.
What is a good CTR for native advertising?
Open-web native typically benchmarks between 0.16% and 0.3%, with premium smartphone placements reaching up to 0.38%. Email newsletter placements consistently outperform these figures. CTR should always be evaluated alongside post-click engagement — a high CTR that leads to immediate bounces signals a creative-content mismatch.
How do you optimize native ad campaigns for better engagement?
Launch with multiple headline and image variants, then use CTR-plus-dwell-time together to diagnose what's working. Refine targeting toward segments with the strongest engagement-to-conversion ratio, and make sure landing content matches the ad's promise — creative and destination must function as a unit.
What is the difference between viewability and attention in native advertising metrics?
Viewability confirms an ad met the MRC standard (≥50% pixels in view for ≥1 second for display), meaning it had the opportunity to be seen. Attention metrics — in-view time, interaction rate, attention quality indices — measure whether the audience actually engaged with it. Viewability is the entry requirement; attention is the outcome you're actually optimizing for.
How do you scale a native advertising campaign once it's performing well?
Before scaling, confirm stable CPA, above-benchmark CTR, and strong scroll depth at test budget. Then expand horizontally (new channels or audience profiles matching your best-performing context) and vertically (higher budget to proven placements). Geo-based incrementality tests confirm you're driving genuine lift, not just capturing existing intent.
Why is email newsletter native advertising easier to measure than web-based native ads?
Email delivers ads directly to opted-in readers — no ad blockers, no third-party cookie dependency, no render issues — so every click is logged against first-party data and UTM parameters pass cleanly to GA4. Open-web native contends with a 21% average ad block rate plus signal loss from ATT and privacy browser settings, making email the structurally cleaner measurement environment.