

The problem isn't collecting data. It's collecting the right data. Native ads are built to earn attention and drive brand-level outcomes, not to generate last-click conversions. Applying standard display benchmarks to native campaigns produces misleading results—and often causes advertisers to abandon campaigns that are actually working.
This guide covers what to set up before you measure, which metrics matter and why, three practical measurement approaches, and how to interpret results without drawing the wrong conclusions.
Key Takeaways
- Native ads serve top- and mid-funnel goals; last-click conversions are rarely the right success metric
- Set your campaign objective first (awareness, consideration, or conversion), then choose your metrics
- Core behavioral metrics: CTR, time on page, scroll depth, bounce rate, social shares
- Brand lift surveys measure perception shifts by comparing exposed vs. unexposed audiences
- Attribution is the hardest part: multi-touch models and assisted conversions give a more accurate picture than last-click alone
What You Need Before You Start Measuring
Measuring without a defined goal produces noise. The first decision is declaring whether the campaign is built for awareness, consideration, or conversion, because each objective demands a different primary KPI. An awareness campaign succeeds when brand recall improves; a conversion campaign succeeds when sign-ups increase. Conflating the two is where most measurement errors begin.
Tools and Access Points Required
Before launch, confirm you have:
- UTM parameters on every native ad link, consistently named by source, medium, and campaign
- GA4 with enhanced measurement enabled—specifically scroll-depth events and Engaged Sessions configured
- Publisher campaign dashboard access for impression, CTR, and time-on-page data
- Optional: third-party verification tags (IAS, Oracle Moat) for viewability and attention data on open-web placements
For newsletter-based placements—like those across House of Summary's network of Presidential Summary, Geopolitical Summary, Dubai Summary, and London Summary—publisher-side click tracking and audience analytics are typically available directly through the publisher's reporting dashboard. UTM parameters in advertiser links layer your own GA4 data on top, giving you both publisher-side and advertiser-side visibility in one picture.
Baseline and Benchmarking Setup
With your tools in place, the next step is establishing a reference point. Before the campaign goes live, request benchmark data from the publisher. Specifically ask for:
- Average CTR for comparable sponsored content on their platform
- Typical dwell time or time on page for editorial and native placements
- Engagement rates by placement position (primary vs. secondary slots)
Without these reference points, you're evaluating results in a vacuum. A 2% CTR sounds strong until you learn the publisher's newsletter average is 4%.
Key Metrics to Measure Native Advertising Effectiveness
Native ad metrics split into two categories: behavioral metrics (what users did) and perception metrics (what users think or feel). A complete measurement picture requires both.
Time on Page and Scroll Depth
Time on page reveals whether readers consumed the content or left immediately. But time alone can be inflated by idle tabs, so pair it with scroll depth for a more reliable signal.
GA4's enhanced measurement fires a scroll event when a user reaches 90% vertical depth—a completion-style signal. For longer-form native content, set custom scroll milestones at 25%, 50%, and 75% as well. Nudge reports a typical average scroll depth of 53% across content types, which provides a useful content benchmark.
GA4 also defines an engaged session as lasting more than 10 seconds, triggering a key event, or including at least 2 pageviews—use this as your minimum engagement threshold.
Click-Through Rate (CTR)
CTR is clicks divided by impressions. How you benchmark it depends entirely on format:
| Format | Typical CTR Range |
|---|---|
| Open-web display ads | ~0.05% |
| Open-web native ads | ~0.2% |
| Newsletter sponsorships | 1.3%–12.5% (category-dependent) |
Newsletter native placements consistently outperform open-web formats because they reach readers in a distraction-free, opted-in environment. Paved's 2026 newsletter sponsorship data shows category click rates ranging from 1.3% (household) to 12.5% (education)—multiples above open-web native benchmarks.
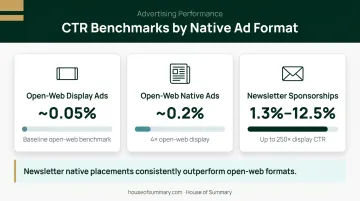
The key rule: never compare newsletter CTR to display CTR. They're different formats with different audience contexts.
Bounce Rate and Session Duration on Your Site
These two metrics work together:
- Bounce rate measures whether click-through visitors engaged with your site at all
- Session duration measures how long they stayed after clicking
A high bounce rate post-click signals audience-content mismatch—the native ad attracted clicks, but the landing page didn't deliver what readers expected. High session duration alongside low bounce rate confirms the native content attracted the right audience.
Brand Lift and Perception Metrics
Behavioral metrics tell you what people did. Brand lift measurement tells you what they thought. It runs controlled surveys comparing audiences exposed to the native ad against a matched control group that wasn't exposed. It tracks:
- Aided brand awareness
- Ad recall
- Favorability
- Purchase intent
Nielsen's research across more than 100 branded content pieces found that branded content generated 86% average brand recall versus 65% for pre-roll ads—a significant gap that illustrates why content-led native formats outperform on perception metrics.
Brand lift studies require sufficient campaign scale for statistically significant results, with providers like Nielsen and Kantar offering standardized methodologies.
Three Practical Approaches to Measurement
No single method captures the full picture of how native advertising performs. Each approach below measures a different layer of impact — behavioral, perceptual, and conversion-based — and most campaigns benefit from combining at least two.
Approach 1: Behavioral Analytics Tracking
What it measures: What users do during and after exposure—on the publisher's page and on your site after clicking through.
Tools needed: UTM-tagged URLs, GA4 with enhanced measurement, Tag Manager scroll-depth trigger, publisher analytics dashboard.
How to implement:
- Configure GA4 events (scroll depth milestones, engaged time, CTA clicks) before launch
- Add UTM parameters to all native ad links using consistent naming
- Compare post-click behavior (session duration, pages visited, conversion events) segmented by native traffic source
- Request publisher-side time-on-page and CTR data to validate on-site engagement against source-level performance
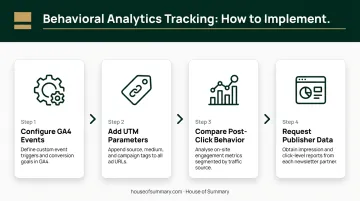
Best for: Consideration and conversion-stage campaigns where on-site behavior is measurable. Limited for pure awareness campaigns where impact happens before the click.
When behavioral data shows what users did, it doesn't tell you what they now think. That's where brand lift measurement comes in.
Approach 2: Brand Lift Measurement
What it measures: Perception change—awareness, recall, favorability, and intent—among exposed versus unexposed audiences.
Tools needed: Third-party brand lift survey provider (Nielsen, Kantar, or platform-native tools); sufficient reach to generate statistically significant sample sizes.
How to implement:
- Define the perception metric you want to move (aided awareness, purchase intent, etc.)
- Set up an exposed group and a matched control group
- Run surveys during and after the campaign flight
- Calculate the lift delta between groups
- Identify which creative or placement drove the largest shift
Best for: Upper-funnel, brand-building campaigns. Requires meaningful budget and audience scale—smaller campaigns may not generate reliable results.
For campaigns with defined business outcomes, attribution tracking connects the earlier two layers to measurable revenue activity.
Approach 3: Attribution and Conversion Tracking
What it measures: Connects native ad exposure to downstream outcomes—leads, purchases, sign-ups—using click-through and view-through attribution.
Tools needed: GA4 conversion goals or CRM with UTM source tracking, multi-touch attribution model, pixel-based view-through attribution where available.
How to implement:
- Define the conversion event before launch (form submission, purchase, email sign-up)
- Track click-through conversions via UTM source in GA4
- Apply a view-through attribution window (7–14 days) to capture influenced users who didn't click immediately
- Use incrementality tests (geo holdout or matched market) where budget allows
Important caveat: The IAB State of Data 2024 reports that 73% of companies expected reduced ability to attribute campaign performance and track post-view conversions, due to iOS ATT, cookie deprecation, and identifier loss. Build this into your reporting framework upfront: set relative benchmarks against previous campaigns rather than treating any single conversion number as an absolute count.
How to Interpret Your Native Advertising Results
Numbers only have meaning in context. A 0.2% CTR on an open-web native placement and a 0.2% CTR on a premium newsletter placement are very different outcomes—the former is at benchmark, the latter is likely underperforming.
Healthy performance looks like:
- CTR at or above the publisher's sponsored content average for that placement position
- Time on page exceeding the site's editorial average
- Bounce rate below the site's typical organic benchmark
- Scroll depth above 50% for content-led placements
Signs of underperformance:
- High CTR + high bounce rate = audience-content mismatch (the headline attracted clicks, the content didn't deliver)
- Low time on page despite reasonable CTR = wrong content format for this audience
- Flat brand lift in an awareness campaign = content lacked differentiation or reached the wrong segment
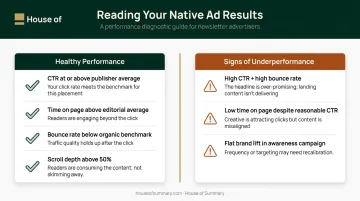
One pattern worth calling out: strong brand lift combined with modest CTR is actually a good sign—the content is working as a true awareness driver, delivering impact before the click.
The inverse warrants scrutiny. CTR that runs well above a publisher's editorial average can sometimes signal poor disclosure labeling, where users click because they don't realize it's an ad. That's both an FTC compliance risk and a data quality problem—clicks from confused readers don't reflect genuine interest.
Once you can distinguish strong signals from misleading ones, you're ready to make meaningful optimization decisions.
Common Errors in Measuring Native Advertising
Applying Display Metrics to Native Campaigns
Optimizing purely for CTR — without accounting for time on page, scroll depth, or brand lift — causes advertisers to misread native's value. The result: campaigns get cut that were actually working at the top of the funnel.
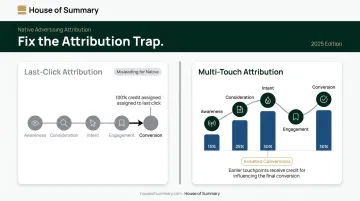
The Attribution Trap
Crediting only last-click conversions makes native ads look underperforming almost by design. Native typically influences users early in the journey, not at the moment of purchase. Fix this by:
- Tracking assisted conversions in GA4
- Using multi-touch attribution models
- Applying view-through conversion windows
Other common pitfalls:
- Launching without UTM parameters and being unable to isolate native traffic from direct traffic
- Comparing newsletter ad CTR to social display norms (different formats, different contexts)
- Failing to request publisher benchmark data before the campaign goes live
- Treating low CTR on a brand lift campaign as failure when clicks were never the goal
Frequently Asked Questions
What is native advertising in simple words?
Native advertising is paid content designed to match the look, feel, and format of the platform where it appears—so it reads like an article, newsletter, or editorial piece rather than a traditional banner ad. It's still labeled as sponsored content, but it fits the surrounding environment rather than interrupting it.
What is a good CTR for native advertising?
It depends entirely on the format. Open-web native averages around 0.2% versus 0.05% for display. Newsletter sponsorships vary by category, ranging from roughly 1.3% to 12.5% based on Paved's 2026 data. Always benchmark against the publisher's own sponsored content averages for that specific placement.
How do you measure brand lift from a native advertising campaign?
Brand lift is measured by comparing survey responses between an exposed group (who saw the ad) and a matched control group (who didn't), tracking aided awareness, ad recall, and purchase intent. Providers like Nielsen and Kantar offer standardized methodologies; some platforms also include native lift tools as part of campaign packages.
What tools are used to track native advertising performance?
Most campaigns rely on GA4 and Google Tag Manager for behavioral and on-site tracking, publisher dashboards for impression and CTR data, Oracle Moat or IAS for viewability verification on open-web placements, and brand lift survey providers for perception measurement.
How is measuring native advertising different from measuring display advertising?
Display relies heavily on impressions and click-based metrics. Native—because it aims to inform or engage rather than interrupt—requires deeper signals like time on page, scroll depth, and brand lift to demonstrate its true impact, particularly for upper-funnel campaigns where a click was never the primary goal.
How long should a native ad campaign run before measuring results?
Behavioral metrics like CTR and time on page can be read after a few days of sufficient volume. Brand lift studies need several weeks of campaign flight to build a statistically significant sample—so set a pre-defined measurement window before launch, aligned to your campaign objective.