Introduction
Most advertisers running native ads in executive newsletters treat click-through rate and open rates as the final word on campaign performance. Those metrics confirm the email was received and a link was clicked. They reveal nothing about whether the brand message actually shifted how decision-makers perceive your company.
For brands investing in premium newsletter placements to reach decision-makers, this measurement gap is costly. Strong CTR with flat brand perception means you're driving traffic but not building the long-term brand equity that justifies premium CPMs.
This guide covers the specific KPIs, measurement methods, and interpretation frameworks for tracking brand lift from native newsletter ads. The approach is adapted to the inbox environment, where executive readers engage on their own terms — not on an algorithm's schedule.
Key Takeaways
- Brand lift measures shifts in awareness, recall, favorability, and purchase intent caused by your ad — not just clicks or opens
- Establish a pre-campaign baseline and define exposed vs. control audience segments before launch
- Run pre/post surveys, exposed vs. control group surveys, or branded search lift tracking to capture results
- Expect cleaner brand lift signals from executive newsletter readers — self-selected, focused, and uninterrupted by social feeds or programmatic display
- Interpret results against category benchmarks — a 5-point lift in purchase intent is strong in financial services but unremarkable in mass consumer goods
What You Need Before You Start Measuring Brand Lift
Brand lift measurement requires deliberate setup before a campaign launches. Attempting to measure it retroactively leads to unreliable data because you have no baseline to compare against.
Clarify Campaign Objectives
Identify which brand metric you're trying to move — awareness, favorability, consideration, or message association. Each requires a different survey structure and benchmark for success.
Don't try to measure everything at once on a small budget. Google recommends measuring a maximum of 3 metrics per study to avoid indecipherable data. Focus on the one or two KPIs that directly support your marketing goal — awareness for new product launches, favorability for reputation repair, or purchase intent for demand generation.
Establish a Pre-Campaign Baseline
Run a short pre-campaign survey among your target subscriber segment before the campaign launches, documenting the starting point for each KPI. Without this baseline, all post-campaign data is anecdotal.
Your baseline survey should ask the exact questions you'll ask post-campaign:
- Do you recognize Brand X? (aided awareness)
- Which brands come to mind when you think of Category Y? (unaided awareness)
- How favorably do you view Brand X? (favorability scale)
- Would you consider Brand X for your next purchase? (consideration)
Alternatively, pull branded search volume data for 4-6 weeks before launch as a proxy baseline.
Define Your Exposed and Control Groups
Split newsletter subscriber lists into an exposed group (receives the issue with the native ad) and a control group (receives a version without the ad or a different publication). Without clean segmentation, you can't attribute lift to ad exposure with any confidence.
In premium newsletter environments built around executive and business readers, this split is more reliable than broad web panels. Subscribers share a defined professional profile, so exposed and control groups differ in one variable — whether they saw the ad — rather than in demographics, intent, or context.
House of Summary's network, for example, reaches decision-makers, executives, and policy professionals with a 66% U.S. concentration and strong UK and UAE representation. That consistency across the subscriber base means exposed vs. control comparisons reflect ad impact rather than audience noise.
Key Brand Lift KPIs to Track for Executive Newsletter Advertising
No single metric tells the full story. Brand lift requires a set of complementary KPIs that trace the arc from initial exposure to purchase intent.
Executive newsletter native ads are particularly strong for mid-funnel metrics because readers are in an active reading state rather than passive scrolling.
Ad Recall
Ad recall measures the percentage of exposed readers who remember seeing the sponsored content after the campaign. Strong recall in a newsletter context signals the creative format and editorial integration were effective — not just that the email was opened.
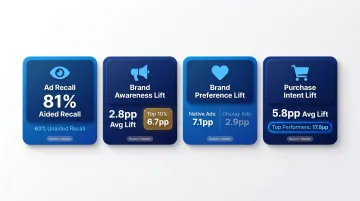
Benchmark context: Nielsen reports aided recall of 81% and unaided recall of 63% for branded content, making ad recall the single largest driver of brand lift at 38.7% of total lift. Newsletter native ads, which combine opt-in distribution with long-form content, should aim for recall rates closer to branded content benchmarks than web display.
Brand Awareness Lift
Track both unaided awareness (readers naming the brand unprompted) and aided awareness (recognizing the brand when shown a list). The delta between pre- and post-campaign responses reveals whether the campaign expanded the brand's footprint among the subscriber audience.
Benchmark context: Native advertising delivers an average awareness lift of 2.8 percentage points, with top 10% of campaigns achieving 6.7 percentage points. Newsletter campaigns should target the upper end of this range given the focused, distraction-free inbox environment.
Brand Favorability and Perception
Favorability measures whether readers now view the brand more positively after exposure — critical for brands using executive newsletters to shift sentiment, not just build visibility.
This is relevant for finance, luxury, and B2B brands advertising in high-trust editorial environments. House of Summary's newsletters are human-written and fact-checked, creating a brand-safe editorial context that elevates favorability lift potential.
Benchmark context: Native advertising averages a preference lift of 7.1 percentage points — more than double display advertising's 2.9 percentage points.
Message Association
Message association measures the percentage of readers who correctly connect the campaign's core claim or value proposition back to the advertising brand. This metric is uniquely important in newsletter native ads, where readers engage with longer-form sponsored content and are therefore more capable of retaining a specific message.
For example, if your campaign positions your fintech product as "the fastest cross-border payment solution for global teams," post-campaign surveys should measure what percentage of exposed readers associate that specific claim with your brand.
Purchase Intent and Consideration
Consideration lift (would you consider this brand for your next purchase/decision?) bridges upper-funnel brand building with measurable business outcomes.
For B2B and executive audiences, phrasing matters. Use questions calibrated to how these readers actually make decisions:
- "How likely are you to recommend Brand X to your organization?" (B2B consideration)
- "Would you shortlist Brand X when evaluating solutions in this category?" (executive decision-maker framing)
- Avoid consumer-focused phrasing like "Would you buy this product tomorrow?"
Benchmark context: Native advertising delivers an average action intent lift of 5.8 percentage points, with top performers reaching 17.8 percentage points.
Methods to Measure Brand Lift from Native Newsletter Ads
Three practical methods exist for measuring brand lift in newsletter advertising. The right choice depends on campaign size, budget, and whether you can segment subscriber data. Here's how each one works.
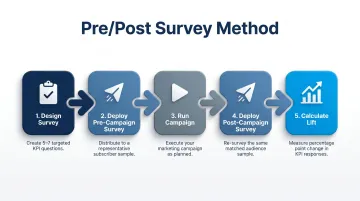
Method 1: Pre/Post Survey
Survey the same (or statistically matched) audience before and after the campaign runs, measuring changes in each KPI. This is the most intuitive method and works well for longer campaigns.
Tools Needed:
- Survey platform (Typeform, SurveyMonkey, or purpose-built brand lift tool)
- Access to representative sample of newsletter subscribers or lookalike panel
Steps:
- Design a short 5-7 question survey covering your chosen KPIs
- Deploy to subscriber sample before campaign launches
- Run the campaign
- Deploy identical survey to same or matched sample post-campaign
- Calculate percentage point change in each metric
Pros:
- Easy to run and explain to stakeholders
- No need for publisher to support segmented distribution
- Clear before/after narrative
Cons:
- Vulnerable to external factors (news events, competitor activity) that shift brand perception between survey waves
- Requires sufficient time gap (4-6 weeks minimum) to avoid survey fatigue if using the same respondents
- Cannot isolate your campaign's effect from other marketing activity during the window
Method 2: Exposed vs. Control Group Survey
Simultaneously survey readers who received the issue containing the native ad (exposed) and readers who did not receive it or received a version without the ad (control), then measure the difference in brand KPIs between the two groups.
Tools Needed:
- Ability to segment newsletter distribution by subscriber cohort
- Survey tool that can be deployed to both groups simultaneously
Sample size note: Plan for a minimum of 2,000–5,000 responses per group per metric to achieve statistical validity.
Steps:
- Segment subscriber list into exposed and control cohorts before send
- Deploy campaign to exposed group only
- Within 48-72 hours of send, deploy identical brand lift surveys to both cohorts
- Compare responses on each KPI to calculate lift
Pros:
- More statistically robust than pre/post because external factors affect both groups equally
- Isolates your campaign's incremental effect
- Industry standard method used by Google, Meta, and major platforms
Cons:
- Requires publisher support for segmented distribution
- Not all newsletter publishers can support this methodology
- Smaller lists may struggle to reach minimum sample size per group
Publishers with structured subscriber data — such as House of Summary, which tracks geographic distribution, engagement tiers, and audience profiles — are better positioned to support cohort segmentation than ad networks with anonymous audiences.
Method 3: Brand Search Lift Tracking
Use branded search query volume as a proxy for brand lift. If exposure to a native ad in an executive newsletter drives readers to search for the brand, this signals increased awareness and intent.
Tools Needed:
- Google Search Console or Google Trends access for the advertised brand
- Campaign send dates and audience geography
- Pre-campaign baseline period of equal length (4-6 weeks)
Steps:
- Document baseline branded search volume for 4-6 weeks before campaign
- Note campaign send date(s)
- Monitor weekly branded search volume for 4-6 weeks post-campaign
- Identify statistically notable spikes correlated with send dates
- Cross-reference against other marketing activity to isolate newsletter contribution
Pros:
- Low cost and requires no survey infrastructure
- Objective behavioral signal rather than self-reported data
- Tracks continuously across multiple campaigns without additional setup
Cons:
- Only captures awareness-level lift (readers who took action)
- Misses favorability and message association
- Can be confounded by other concurrent marketing
- Best used as corroborating signal rather than primary measurement
Benchmark context: Les Binet's research shows branded search share has a 0.83 correlation with market share, validating search volume as a viable brand lift proxy.
How to Interpret Your Brand Lift Results
Raw lift numbers mean little without context. A 3-point lift in brand awareness is excellent for a well-known enterprise brand but poor for an unknown startup. Evaluate results against category benchmarks, campaign objectives set pre-launch, and the relative cost of achieving that lift.
Acceptable / Strong Lift
Newsletter native ads reach readers in algorithm-free inbox environments where subscribers have actively chosen their topics — which tends to produce stronger brand lift signals than typical web native placements.
Strong performance benchmarks:
- Awareness lift: 4-7 percentage points (top quartile for native)
- Consideration lift: 7-14 percentage points (top quartile range)
- Preference lift: 10-21 percentage points (top quartile range)
- Action intent lift: 8-17 percentage points (top quartile range)
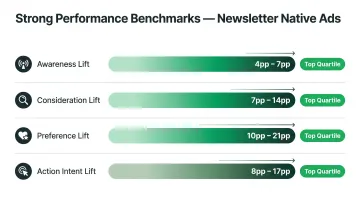
However, business publishers average lower total brand lift (17.7%) versus lifestyle publishers (23.8%). Executive newsletter advertisers should expect more conservative lift figures than consumer-focused placements and factor this structural difference into success criteria.
Modest Lift: Investigate Before Concluding
Positive but small lift (1-3 percentage points across metrics) may indicate one of three root causes:
- Creative misalignment: The ad wasn't integrated with the newsletter's editorial tone — readers perceived it as promotional rather than informative. Rewrite in the publication's voice, focusing on storytelling over product features.
- Audience segment mismatch: The subscriber cohort doesn't match your ideal customer profile. Shift to a different newsletter within the same network — for example, move a wealth management campaign from a general business newsletter to a finance-focused publication.
- Insufficient exposure: The campaign ran too briefly. Meta recommends a minimum 14-day campaign duration, and most brand lift studies require 4-8 weeks to produce reliable data. Extend the run or increase frequency to 3-4 sends across multiple weeks.
No Lift or Negative Movement
Flat or declining scores on favorability or consideration post-campaign point to deeper problems:
- Message misalignment: The campaign message contradicts what the audience cares about or believes.
- Brand safety issue: The ad ran adjacent to content that created negative associations.
- Editorial identity mismatch: The newsletter's identity and the ad content simply don't fit together.
In high-trust editorial environments, readers have a strong relationship with the publication. When an ad feels like it violates that compact, favorability scores don't just stagnate — they drop. Treat any negative movement as a signal to pause, not optimize.
Turning Results Into Action
Brand lift data should feed directly into the next campaign decision:
- Weak consideration despite strong awareness? Shift creative to address specific barriers — price objections, trust gaps, competitive alternatives.
- Low recall scores? Test longer-form storytelling formats rather than short promotional placements.
- Strong results in one newsletter, weak in another? Reallocate budget toward the placement that's working and audit the underperformer for audience fit.
Running lift studies consistently across campaigns — rather than as one-off exercises — builds a proprietary benchmark. Over time, that means tighter success criteria, more accurate pre-campaign predictions, and faster audience selection decisions.
Common Mistakes That Skew Newsletter Brand Lift Data
Most errors in newsletter brand lift measurement come not from bad intentions but from applying web display measurement logic to an environment that works differently.
Measuring Clicks Instead of Brand Metrics
Click-through rate and open rate are delivery metrics, not brand metrics. They confirm the ad was received and triggered an action, but they cannot tell you whether the reader now thinks more favorably of the brand, remembers the message, or would consider purchasing.
Optimizing a newsletter native campaign toward CTR while the actual brand objective goes unmeasured is a common trap. High CTR with flat favorability means you're driving traffic but not building brand equity.
Skipping the Pre-Campaign Baseline
Launching a survey only after the campaign ends leaves no reference point. Any post-campaign score is meaningless without knowing where the brand stood before.
Run a short pre-launch survey to a small subscriber sample before the first send. Aim for 200–500 baseline responses minimum to establish directional starting points for awareness and favorability.
Using Too Small a Sample or Too Short a Campaign Window
Drawing conclusions from statistically insignificant sample sizes produces unreliable data. Google recommends 2,000-5,000 survey responses per metric per group to detect the typical native awareness lift of 2.8 percentage points.
Smaller newsletter audiences need longer run times to hit those thresholds. A single-send campaign in a small publication will rarely yield actionable data — plan accordingly.
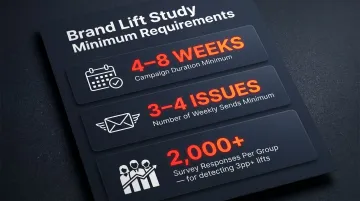
Minimum thresholds:
- Campaign duration: 4-8 weeks minimum
- Number of sends: 3-4 weekly issues minimum
- Survey responses per group: 2,000+ for detecting lifts of 3 percentage points or larger
Frequently Asked Questions
Frequently Asked Questions
How do you measure brand uplift?
Brand uplift is measured by surveying exposed and control audiences on KPIs like awareness, favorability, and purchase intent, then calculating the percentage point difference between the two groups to isolate the campaign's incremental effect. Results are reported at 95% statistical confidence.
How to measure brand search lift?
Brand search lift is measured by tracking branded search query volume before and after a campaign launch using Google Search Console or Google Trends, then identifying statistically notable increases correlated with the campaign send dates. Baseline and post-campaign periods should be equal length (4-6 weeks each).
What is a good brand lift benchmark for executive newsletter native ads?
Target 4-7 percentage points for awareness lift and 7-14 percentage points for consideration lift. Business publisher environments average 17.7% total lift versus 20.6% for native advertising overall, so adjust expectations downward for B2B newsletter placements.
How long should a native newsletter ad campaign run before measuring brand lift?
Most brand lift studies need a minimum of 4-8 weeks of exposure to build a statistically reliable sample. Campaigns with fewer than 3-4 sends rarely yield meaningful data, especially for newsletters with subscriber bases under 50,000.
Can you measure brand lift without a control group?
A pre/post survey design can substitute for a control group in smaller campaigns. Treat results as directional signals rather than definitive proof, since external factors can shift brand perception between survey waves.
What is the difference between brand lift and click-through rate in newsletter advertising?
CTR measures an immediate behavioral response (clicking a link) while brand lift measures a shift in perception, awareness, or intent. CTR can be high while brand lift is flat, meaning the ad drove traffic but did not change how readers feel about the brand.