Introduction
Native advertising in executive newsletters offers premium access to high-intent, hard-to-reach decision-makers, yet brands routinely underestimate or mismeasure the return. Many overcount surface-level clicks while dismissing placements that have been steadily influencing pipeline over weeks or months.
76% of marketers cite poor data quality or integration as a barrier to measurement, and Apple Mail Privacy Protection has artificially inflated open rates — forcing brands to rethink which metrics actually signal engagement.
Executive audiences operate on long B2B sales cycles, often 10+ months, yet advertisers frequently judge campaigns within 48 hours of a send.
This guide walks through the exact steps to measure ROI correctly in this format, the metrics that actually matter in an inbox-first environment, the variables that shift benchmarks, and the mistakes that silently distort measurement accuracy.
Key Takeaways
- Define your campaign goal (awareness, leads, or sales) before launch — each requires a different measurement model
- Email metrics like click-to-open rate (CTOR) reveal more than raw CTR alone
- Set up tracking infrastructure — UTM parameters, dedicated landing pages, CRM tagging — before the campaign launches
- Set ROI windows to weeks or months, not days, to match executive sales cycles
- Audience seniority, ad placement, and content tone each affect what "good performance" actually looks like
How to Measure ROI on Native Ads in Executive Newsletters
Step 1: Define Your ROI Model Before the Campaign Launches
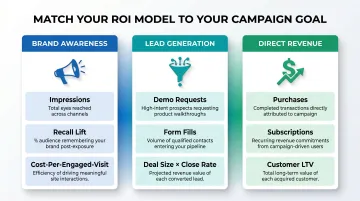
Clarify your conversion goal first. Are you measuring brand awareness (impressions, recall lift), lead generation (demo requests, form fills), or direct revenue (purchases, subscriptions)? Each maps to different success metrics and ROI formulas.
Assign a dollar value to the goal. Without this figure, calculating ROI is mathematically impossible:
- Lead generation: average deal size × close rate
- Subscriptions: customer lifetime value (LTV)
- Awareness: cost-per-engaged-visit or cost-per-impression
For context, email marketing delivers approximately $42 for every $1 spent — a 42:1 ROI that mature programs achieve consistently. B2B cost-per-lead benchmarks range from $63 for Meta Ads to $237 blended average, with industry events costing $700–$2,800 per lead.
Step 2: Build the Tracking Infrastructure
Create unique UTM parameters for every newsletter placement:
utm_source= newsletter name (e.g., PresidentialSummary)utm_medium= emailutm_campaign= campaign nameutm_content= ad variant
These parameters carry attribution through clicks without requiring third-party cookies—cookie-free attribution that works as privacy restrictions tighten.
Set up a dedicated landing page — or at minimum a unique page variant — for newsletter traffic. This isolates behavior from organic, social, or paid web traffic in analytics. A/B testing shows dedicated landing pages boost conversion rates by 116% compared to sending traffic to homepages.
Configure your CRM to capture newsletter-originated leads. Tag source fields so attribution doesn't disappear downstream when leads enter longer sales cycles.
Step 3: Collect Engagement Data from the Newsletter Placement
Request placement-level performance data from the publisher:
- Total sends
- Open rate
- Number of clicks on the native ad unit
- Click-to-open rate (CTOR) — clicks ÷ opens
CTOR isolates readers who actually opened and saw the ad — filtering out deliverability noise that inflates raw CTR.
B2B email benchmarks for context:
| Industry | CTOR | CTR |
|---|---|---|
| Financial Services | 10.1% | — |
| IT/Tech | 9.8% | — |
| Professional Services | 11.1% | — |
| Industry average | — | 2.0–3.2% |
Forward rate and reply rate, where available, signal strong resonance with executive audiences. Average B2B email reply rates range from 3.4% to 5.1%, with top performers reaching 12%.
Publisher metrics only tell half the story — here's what to track once that click lands on your site.
Step 4: Measure Downstream Performance on Your Own Properties
Connect upstream engagement to downstream behavior. Track newsletter-sourced visitors on your landing page:
- Time on page
- Scroll depth
- Bounce rate
- Conversion rate
These metrics reveal whether your ad's promise aligns with landing page content — a high click volume with a 90% bounce rate signals creative mismatch, not a working campaign.
Track full-funnel outcomes: form submissions, demo bookings, purchases — whatever your defined conversion event is. Pull this data into a unified view alongside newsletter placement metrics.
Benchmark context: B2B SaaS demo request pages convert at 1.5–4%, while self-serve signup pages reach 4–10%.
Step 5: Calculate ROI and Compare Against Appropriate Benchmarks
Use the standard ROI formula:
(Revenue or Pipeline Value Generated − Cost of Newsletter Placement) ÷ Cost of Newsletter Placement × 100
For brand awareness goals, substitute proxy metrics like cost-per-engaged-visit or cost-per-qualified-lead.
Don't benchmark email against display. B2B email CTR ranges from 2.0–3.2%, while display banner CTR averages just 0.46% and programmatic display sits around 0.1%. Applying display benchmarks to email campaigns systematically undervalues performance by 5–10x.
The CPM gap between newsletter sponsorships ($40–$90) and programmatic display ($3–$8) looks wide until you calculate cost-per-qualified-lead — at that point, the higher-CPM channel often wins on efficiency.
| Channel | Typical CPM | Typical CTR |
|---|---|---|
| B2B Newsletter | $40–$90 | 2.0–3.2% |
| Display Banner | $3–$8 | ~0.46% |
| Programmatic Display | $3–$8 | ~0.1% |
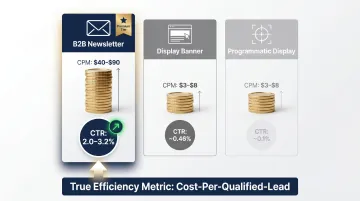
Use cost-per-qualified-lead as your final arbiter — it's the number that actually predicts pipeline value.
Key Metrics That Actually Matter for Executive Newsletter Native Ads
The closed, inbox-first environment requires a different metric hierarchy than web-based advertising. Metrics that look weak in display contexts may indicate strong performance here.
Click-to-Open Rate (CTOR)
Definition: CTOR = clicks ÷ opens (not total sends)
This is the most important early-funnel signal. It isolates engagement among readers who actually saw the ad, filtering out non-openers and inflated counts from Apple Mail Privacy Protection.
Good CTOR ranges from 6–17% depending on industry, with financial services at 10.1%, IT/tech at 9.8%, and professional services at 11.1%.
Qualified Traffic Quality Metrics
Time on page, scroll depth, and bounce rate indicate content-promise alignment. A high click volume with poor downstream engagement signals a creative mismatch.
Use these to diagnose whether your ad messaging matches the landing page experience and whether the audience is genuinely interested. Strong engagement here is what makes conversion tracking meaningful — which brings us to the next layer.
Conversion Rate and Cost Per Acquisition (CPA)
Newsletter-specific CPA formula: Total Newsletter Placement Cost ÷ Conversions from Newsletter Traffic
For executive audiences, CPA will exceed B2C benchmarks but is justified by lead quality. Blended B2B average CPL is $237, with paid search at $75–$120 and events at $700–$2,800.
Pipeline and Revenue Attribution
For B2B or high-value products, newsletter-sourced leads rarely convert immediately. They enter longer sales cycles that demand assisted attribution modeling. Key benchmarks worth knowing:
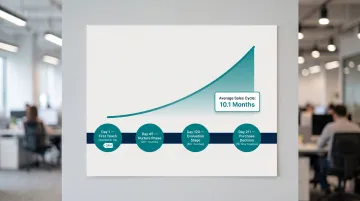
- B2B buyers average 76 touches across 211 days before purchase
- Sales cycles now average 10.1 months end-to-end
- CRM tagging at the lead source captures revenue contribution weeks or months after first contact
Brand Lift Indicators
For awareness campaigns, measure indirect signals:
- Direct traffic spikes during the campaign period
- Branded search volume increases
- Post-campaign survey data on awareness or consideration
Executive audiences often respond through indirect signals before direct conversion. Tracking these proxy indicators in the 24–72 hours after each send gives you an early read on whether the campaign is building the brand recognition that eventually closes deals.
Key Variables That Shift Your ROI Benchmarks
ROI benchmarks are not universal. Results vary significantly based on controllable and environmental variables. Misreading them leads to pulled campaigns that were two placements away from profitability.
Audience Seniority and Industry Relevance
Tighter alignment between your offer and the newsletter's executive audience drives higher conversion efficiency. A CFO-targeted financial tool advertised in a finance-focused newsletter will outperform a consumer product in a C-suite geopolitical briefing.
73% of B2B buyers prefer email as their main vendor communication channel, but 73% actively avoid suppliers sending irrelevant outreach. Relevance is decisive.
House of Summary's network of specialized newsletters — Presidential Summary, Geopolitical Summary, Dubai Summary, London Summary — targets verified executive readers. The company reports click-through rates 4x higher than Google AdWords, a benchmark worth factoring into expectations.
Audience-offer misalignment suppresses click-to-open rate (CTOR) and landing page conversion regardless of creative quality.
Ad Placement Position Within the Newsletter
Native ads placed above the fold or within the first content block typically outperform footer and post-content placements on raw click volume. Bottom-of-newsletter placements, however, can attract more deliberate readers — the ones who scrolled through the full issue before acting.
Position affects both click volume and lead quality, so discuss placement options with your publisher based on whether you're optimizing for reach or conversion intent.
Content Alignment and Ad Tone
Executive newsletters carry a specific editorial voice — factual, concise, high-signal. Native ads that match that tone outperform promotional or mismatched copy, particularly where readers trust the editorial relationship. Native ads that match editorial content avoid banner blindness and consistently achieve higher engagement than standard display formats.
Ads that blend naturally drive higher CTOR and lower bounce rates. Ads that feel out of place damage both performance and brand perception.
Campaign Duration and Send Frequency
Most executive newsletters publish weekly, meaning a single placement delivers one data point. B2B journeys require 76 touches across 211 days on average — a single send tells you almost nothing.
A minimum of 3–4 placements is typically needed before ROI conclusions are statistically meaningful. Under-investing in duration leads to premature cancellations; over-relying on one send introduces variance that distorts your calculations in either direction.
What You Need Before You Start Measuring
Measurement accuracy is set up before the campaign launches, not retroactively. Brands that skip preparation end up with data they cannot trust or act on. Three things must be in place before any send date: tracking infrastructure, a defined conversion goal, and confirmed publisher data access.
Tracking and Attribution Setup
Confirm that:
- UTM parameters are created and tested
- Dedicated landing page is live and instrumented with analytics
- CRM source fields are configured to capture newsletter-originated contacts
All of this must be in place before the newsletter send date.
A Defined Conversion Goal with an Assigned Value
Without a pre-defined conversion event and an assigned value, calculating ROI is impossible. There is no workaround.
If you don't have a lead value, derive one:
- Calculate your average deal size
- Multiply by your historical close rate
- The result is your estimated lead value
For subscriptions, use customer lifetime value (LTV) based on average retention and recurring revenue.
Publisher Data Access
The newsletter publisher must agree to share placement-level performance data: opens, clicks, CTOR at minimum.
Request this before signing a placement agreement. Reputable newsletter networks provide this as standard. Publishers who cannot or will not share placement-level metrics are a risk worth walking away from. Accountability starts with data visibility.
Common Mistakes That Skew Your ROI Results
Applying Web or Social CTR Benchmarks to Email
Display advertising benchmarks sit at 0.28–0.46% CTR, while programmatic averages just 0.1% — both measured against audiences actively ignoring ads.
In an executive newsletter with a curated readership and 50,000 sends, a 0.5–2% click rate represents exceptional qualified engagement. Applying display benchmarks here leads directly to false conclusions about campaign failure.
Measuring ROI Too Early for Long Sales Cycles
Executive decision-makers — particularly in B2B, finance, or luxury categories — rarely convert in the same session or even the same week.
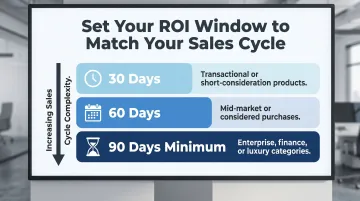
Enterprise software sales cycles run 9–18 months, and 58% of B2B professionals report sales cycles growing longer. Brands that evaluate ROI within 48–72 hours consistently undercount results.
Set a measurement window appropriate to your sales cycle:
- 30 days — transactional or short-consideration products
- 60 days — mid-market or considered purchases
- 90 days minimum — enterprise, finance, or luxury categories
Conflating Correlation with Attribution
When multiple channels run simultaneously, attributing all post-campaign revenue to a single newsletter placement skews ROI in either direction.
Use UTM tagging, CRM source data, and ideally holdout group testing to isolate the newsletter's contribution. Holdout testing compares exposed vs. unexposed audiences, requiring at least 30% of the target population for reliable conclusions.
Frequently Asked Questions
What is the 70/20/10 rule for marketing budget?
Popularized by Coca-Cola and Google, the 70/20/10 framework allocates 70% to proven channels, 20% to emerging opportunities, and 10% to experimental bets. Newsletter native advertising — high-engagement but lower-volume — typically fits the 20% emerging bucket for brands testing it for the first time.
What is the 60/40 rule in advertising?
Drawn from 30+ years of IPA Databank research, the Binet and Field 60/40 principle recommends 60% of budget toward brand building and 40% toward short-term activation. Executive newsletter native ads serve both roles — building credibility with decision-makers while driving measurable actions.
What CTR should I expect from native ads in an executive newsletter?
Click-to-open rate (CTOR) is more reliable than raw CTR — industry benchmarks run 6–17%, with financial services at 10.1% and professional services at 11.1%. Premium audiences with high editorial trust typically push above those averages, often hitting 2–3% raw CTR on total sends.
How do I track conversions from newsletter native ads without third-party cookies?
Email-based native advertising is largely cookie-independent. UTM parameters carry attribution through the click, dedicated landing pages isolate traffic by source, and CRM tagging captures leads without relying on cross-site tracking cookies. UTMs function as URL metadata without setting cookies, making them resilient to cookie deprecation.
Is native advertising in executive newsletters worth the higher CPM compared to programmatic display?
Cost-per-impression comparisons are misleading. Executive newsletter audiences are verified, high-intent, and ad-blocker-immune — CPMs run $40–$90 for B2B sponsorships vs. $3–$8 for programmatic display, but the metric that matters is cost-per-qualified-lead or cost-per-pipeline-dollar, where premium newsletter placements routinely outperform cheaper programmatic inventory.
How many placements do I need before I can evaluate ROI meaningfully?
Plan for at least 3–4 placements — roughly one month in a weekly newsletter. Single-send data points carry too much variance to be statistically reliable, and executive audiences often require multiple exposures before acting. Multi-week campaigns also align better with the 76-touch, 211-day B2B buyer journey.