
Introduction
Media buyers face a uniquely frustrating challenge when advertising across multiple newsletter networks: there's no universal scoreboard. Each network reports different metrics, uses different pricing models, and serves different audiences, making ROI comparison feel like comparing apples to oranges. While one network might boast impressive subscriber counts, another emphasizes open rates, and a third highlights click-through performance—leaving advertisers without a clear answer to the most important question: which network actually delivers results?
Newsletter native advertising ROI comparison is different from web-based programmatic comparisons. Inbox dynamics change everything. 88% of email users check their inboxes multiple times daily, and newsletter ads bypass the ad blockers that affect 42.7% of internet users worldwide.
Without algorithms filtering delivery or visual clutter competing for attention, the numbers carry different weight — and require a different framework to read accurately. This guide walks through how to build that framework: from normalizing metrics across networks to identifying which signals actually predict downstream revenue.
Key Takeaways
- Define one trackable conversion goal before running any campaigns—without this anchor, no comparison is valid
- Track these metrics: open rate (quality signal), effective CTR, cost per click, and cost per conversion
- Control for audience niche, send frequency, ad placement format, and pricing model before drawing any conclusions
- Run identical creatives simultaneously across networks to isolate performance from timing and creative variables
- Audience quality and niche alignment drive ROI differences far more than list price
How to Compare Native Advertising ROI Across Newsletter Networks
Step 1: Define Your Conversion Goal and Set Up Tracking Infrastructure
Specify what "conversion" means for this campaign before any spend is committed. Is it a sign-up, purchase, demo request, or content download? The event must be trackable and measurable—goals like "brand awareness" or "engagement" cannot support an ROI comparison. If you can't assign a dollar value or completion event to the outcome, you can't compare networks meaningfully.
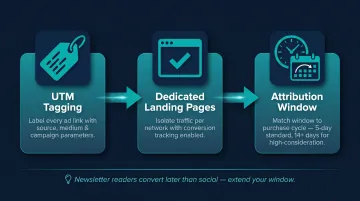
Set up UTM parameters at both campaign and network levels so traffic from each newsletter can be isolated in your analytics platform. Use a consistent naming convention: utm_source=[network_name], utm_medium=newsletter, utm_campaign=[campaign_name]. Without this infrastructure, attribution becomes guesswork, and your comparison will rely on platform-reported clicks rather than verified conversions.
Step 2: Request Standardized Data from Each Newsletter Network
Before buying, request these exact data points from every network:
- Total subscriber count
- Average open rate over the past 90 days
- Average CTR benchmarks for sponsored placements
- Ad pricing model (CPM, CPC, or flat-rate sponsorship)
- Audience demographics (job titles, industries, income levels)
- Editorial niche and content focus
Transparent, verifiable benchmark data signals a credible network. Quality publishers provide historical performance ranges—not just subscriber numbers. If a network won't share open rates or past CTR benchmarks, that's a red flag worth taking seriously.
Step 3: Run Identical Test Campaigns Simultaneously
Simultaneous campaigns eliminate timing variables that can make a weaker network appear stronger simply because of external conditions. News cycles, seasonality, market sentiment, and industry events all affect performance. Running tests at different times introduces variables you cannot control or measure.
Keep every campaign element consistent across networks:
- Creative copy, visuals, and format
- Call-to-action and offer
- Landing page destination
- UTM tracking setup
- Budget tiers allocated to each network
Creative differences quietly corrupt the comparison. Test a benefit-focused headline on Network A and a feature-focused headline on Network B, and you're measuring copy performance—not network performance.
Step 4: Normalize All Results Into a Single Comparison Framework
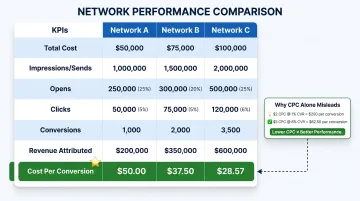
Build a side-by-side comparison table with rows for each KPI and columns for each network tested:
| Metric | Network A | Network B | Network C |
|---|---|---|---|
| Total Cost | $X | $X | $X |
| Impressions/Sends | X | X | X |
| Opens | X | X | X |
| Clicks | X | X | X |
| Conversions | X | X | X |
| Revenue Attributed | $X | $X | $X |
| Cost Per Conversion | $X | $X | $X |
Normalize everything to cost per conversion as the anchor metric. CPC and CTR alone tell you nothing about what happens after the click. A network with a $2 CPC looks cheaper than one with a $5 CPC—until you find the first converts at 1% and the second converts at 8%. The math favors the more expensive click.
What to Measure: Newsletter Ad Metrics That Actually Reflect ROI
Newsletter native advertising has inbox-specific metrics that don't map directly to web display or social ad benchmarks. Interpreting them correctly is essential before any cross-network comparison is valid.
Open Rate as a List Health Indicator
Open rate is not a direct ROI metric—it's a prerequisite quality check. Consistently low open rates signal a disengaged or poorly maintained subscriber list, which predicts weak ad performance at any price point. Financial Services newsletters average 27.1% open rates, while Media & Publishing newsletters average 23.9%, according to Campaign Monitor's analysis of 100 billion+ emails. If a network's open rate falls significantly below industry benchmarks, subscribers aren't reading—and won't see your ad.
Once you've confirmed list health, the next question is engagement quality among those who do open.
Effective CTR Versus Raw CTR
Raw CTR divides clicks by total sends. Effective CTR (also called Click-to-Open Rate or CTOR) divides clicks by opens—reflecting ad relevance to readers who actually engaged. A newsletter with a 2% raw CTR and 20% open rate has a 10% effective CTR. Another with a 3% raw CTR and 50% open rate has only a 6% effective CTR. The second newsletter reaches more people, but the first engages opened readers more effectively.
Higher effective CTR matters most when your goal is conversion, not just reach.
Cost Per Click and Cost Per Conversion
CPC is only the starting point. A network with a lower CPC but a low-intent audience will produce a higher cost per conversion—making it genuinely more expensive despite the headline rate. Always track through to conversion.
Email marketing delivers an average ROI of $36 for every $1 spent—higher than any other digital channel—but only when conversion tracking closes the loop from click to outcome.
Revenue Attribution
Connect newsletter ad clicks to actual outcomes using:
- UTM tagging on every ad link
- Dedicated landing pages with conversion tracking
- Attribution windows matched to your purchase cycle
Klaviyo recommends 5-day click windows for email, but high-consideration purchases may justify 14 days or longer. Newsletter reading is deliberate—readers spend an average of 51 seconds with a newsletter after opening, unlike passive social scrolling. That deliberate behavior means conversions can arrive later than you'd expect from paid social.
The Ad Blocker Advantage
Unlike web and social ads, newsletter placements bypass ad blockers entirely. With 42.7% of internet users worldwide using ad blocking software, impression and click data from web campaigns is structurally incomplete. Newsletter data is more accurate: every send is a real impression, and every click represents genuine intent. This reliability matters for ROI calculation because your baseline metrics are trustworthy—you're not extrapolating from a filtered sample.
Key Variables That Affect ROI Across Newsletter Networks
Two networks can show similar CTRs and CPCs but deliver wildly different ROI. Underlying variables determine the quality of what those metrics represent, not just the numbers themselves.
Audience Quality and Niche Alignment
A smaller, tightly focused subscriber list typically outperforms a large, general-interest list because subscriber intent is higher. Readers of a specialized newsletter are already primed to engage with relevant content.
Brands advertising in vertically aligned newsletters—finance news, geopolitical briefings, city-specific business digests—see stronger downstream conversion rates because the editorial environment primes readers toward relevant topics. For example, a financial services brand placing a native ad in a newsletter like Geopolitical Summary or Presidential Summary reaches a high-intent, globally aware reader that a generic news aggregator cannot match. Segmented email campaigns see 30% more opens and 50% more clicks than unsegmented campaigns, according to HubSpot research.
Consider the 1440 newsletter case study: with 4.5 million subscribers and a 65% open rate, it achieves an average of 2.2 links clicked per opened newsletter. Those numbers are driven by who reads it, not how many.
Send Frequency and Subscriber Attention
Send frequency directly shapes how much attention subscribers give each edition — and therefore each ad placement. More sends don't automatically mean more exposure; they can mean less of it.
Daily sends with multiple sponsors desensitize readers and lower per-ad engagement. Research analyzing 2 billion+ emails found optimal send frequency is approximately every two weeks, with unique open rates declining to 44% by the sixth campaign in a sequence. Weekly or curated sends with limited ad inventory often command more attention per placement, even if total reach per send is lower. 81% of consumers unsubscribe when brands send too many messages, according to Optimove research.
Ad Placement and Editorial Integration
Placement mechanics — where an ad sits, how it's formatted, and how naturally it fits the surrounding content — all affect click rates and reader trust. These aren't cosmetic details; they're conversion levers.
Native placements written in the editorial style of the newsletter outperform inserted display-style ads. Before buying, ask each network for placement specs and examples of past sponsored content. A well-integrated native placement reads like editorial content with clear advertiser disclosure. It fits the reading experience rather than interrupting it.
Pricing Model and How to Normalize It
Networks charge in different ways: CPM (per thousand sends), CPC (per click), or flat-rate sponsorship per edition. These structures aren't directly comparable without conversion.
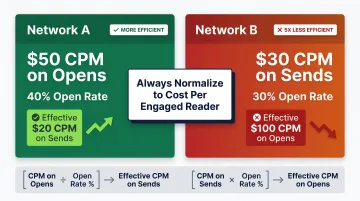
Convert every pricing model into a common denominator — effective cost per thousand engaged readers (opens) — so pricing across networks can be evaluated on equal footing. If Network A charges $50 CPM on opens with a 40% open rate, that's effectively $20 CPM on sends. If Network B charges $30 CPM on sends with a 30% open rate, that's effectively $100 CPM on opens. Network A is five times more efficient at reaching engaged readers. Run this calculation before comparing any two networks on price.
Common Mistakes When Comparing Newsletter Native Ad ROI
Three patterns consistently distort newsletter ROI comparisons—and each one leads budgets in the wrong direction.
Timing mismatches skew network comparisons. Running campaigns on different networks at different times and attributing performance gaps to audience quality is one of the most common errors. News cycles, seasonal buying behavior, and industry events inflate or deflate results in ways that have nothing to do with the network itself. A campaign running during a major industry conference will outperform the same campaign running during a holiday week—regardless of which network carried it.
CTR without conversion tracking rewards the wrong networks. A network with strong click volume but low purchase intent will appear to outperform a higher-quality network that drives actual revenue. This misallocates future spend, rewarding clicks over conversions. Campaign Monitor data shows Financial Services newsletters average 2.4% CTR but 10.1% CTOR—raw click volume and engagement quality are not the same metric.
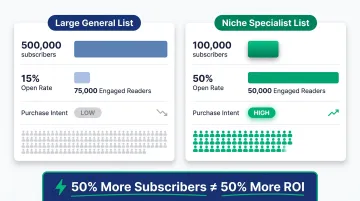
Subscriber count is a poor proxy for reach. Evaluating networks on list size alone, without considering open rates, audience demographics, or niche fit, consistently produces worse ROI per dollar than targeting a smaller, engaged specialist audience. The numbers make this concrete:
| List Size | Open Rate | Engaged Readers |
|---|---|---|
| 500,000 subscribers | 15% | 75,000 |
| 100,000 subscribers | 50% | 50,000 |
The larger list delivers only 50% more engaged readers — but the smaller, niche audience is likely far ahead in purchase intent and conversion quality.
When This Comparison Process Is Worth Running
This full comparison exercise makes strategic sense when:
- You have enough budget to run genuine simultaneous test campaigns on at least two networks
- Your conversion event is fully trackable end-to-end
- Your product or service has a defined target audience that maps to identifiable newsletter verticals
Brands with niche targeting needs gain the most from systematic newsletter ROI comparison. Finance products, luxury goods, international services, and executive-level decision-maker audiences see the most pronounced variation in performance across specialized versus general-interest newsletter networks.
The audience quality difference between a newsletter read by CFOs and one read by general business enthusiasts is substantial — and that gap shows up in conversion rates, not just clicks.
For professionals who read industry newsletters daily, network selection is the primary variable worth testing. For mass-market consumer products with broad appeal, the network difference is less pronounced — creative, offer, and timing will drive more variance than which platform you choose.
Frequently Asked Questions
What is a native ad placement?
A native ad placement is a paid advertisement designed to match the look, feel, and tone of the editorial content surrounding it. In newsletters, this typically means a sponsored segment written in the newsletter's voice rather than a banner or pop-up.
What are the three common formats of native advertising?
The main formats are in-feed sponsored content, content recommendation widgets (web platforms), and branded articles. In newsletter networks, in-feed sponsored segments dominate—integrated directly into the reading flow with clear advertiser disclosure.
What metrics should I use to compare newsletter native ad ROI across networks?
Use effective CTR (clicks divided by opens), cost per conversion, open rate as a list health proxy, and revenue attributed within a defined post-click window. All metrics must be measured with consistent UTM tracking across all networks to ensure valid comparisons.
How do I know if a newsletter network's audience matches my target customer?
Before buying, request the network's audience demographics, subscriber acquisition sources, and editorial niche. Open rate data is a reliable engagement proxy—high open rates signal an active readership more likely to respond to relevant ads.
How long should I run a newsletter ad campaign before measuring ROI?
Unlike social ads, newsletter ad ROI often takes longer to materialize because readers consume content deliberately. Plan for at least 4–6 newsletter sends before conversion data becomes statistically meaningful, and extend attribution windows at least 14 days post-send for high-consideration products.
Is newsletter native advertising more effective than programmatic web native ads?
Newsletter native ads offer advantages that programmatic web placements cannot: no ad blockers (which affect 42.7% of web users), no algorithm-driven delivery variability, and an opted-in audience that is actively reading. Newsletter CTRs average 2.3% to 2.6%, compared to Google Display ads averaging 0.46% CTR—a 5x difference reflecting both technical advantages and audience intent.