

Introduction
Many marketers religiously track email metrics without ever asking the critical question: "What does 'good' actually look like?" The answer is far from universal. Benchmarks fluctuate wildly based on industry, email type, list quality, and sending strategy. A 30% open rate might signal underperformance in the nonprofit sector, while representing exceptional results in retail.
This guide presents the most current email marketing benchmarks across open rates, click-through rates, click-to-open rates, and unsubscribe rates—broken down by industry and email type—so you can make informed comparisons rather than blind guesses.
Before reading those numbers, there's one methodological caveat worth understanding. Apple's Mail Privacy Protection (MPP), introduced in September 2021, has altered open rate tracking significantly. MPP pre-loads tracking pixels in the background, artificially inflating open rates across the board. Over 50% of email opens now occur on Apple Mail with MPP enabled, meaning reported open rates from 2022 onward must be interpreted with caution. Clicks remain a reliable signal. Apple doesn't pre-fetch links, so click data is unaffected.
Key Takeaways
- Average email open rates range between 26% and 45%, depending on data source and industry segment
- Newsletter open rates typically outperform promotional emails due to subscriber intent and editorial focus
- Track CTR, CTOR, and unsubscribe rate alongside opens for a complete engagement picture
- Send times of 8–10am or 5–7pm on Tuesday through Thursday tend to drive the highest open and click rates
- Industry, email type, list hygiene, and subject lines drive the biggest performance variations
Key Email Marketing Metrics You Should Know
Open Rate
Open rate measures the percentage of delivered emails that recipients open. The formula:
(Unique opens ÷ Delivered emails) × 100
Most email platforms calculate this automatically. The distinction between unique opens (individual subscribers who opened) and total opens (all open events including repeats) matters—unique open rate provides the more meaningful benchmark.
Since MPP's introduction, open rate data has become directionally useful rather than definitively accurate. Because Apple pre-fetches tracking pixels, an "open" may register even when the recipient never actively views the email.
Click-Through Rate (CTR)
CTR measures the percentage of delivered emails that received at least one link click:
(Clicks ÷ Delivered emails) × 100
Unlike opens, clicks require intentional human action and aren't pre-fetched by MPP, making CTR one of the most reliable engagement signals available post-2021.
Click-to-open rate (CTOR) measures clicks only among recipients who opened:
(Clicks ÷ Opens) × 100
CTOR isolates content relevance—how compelling your email is to those who chose to engage. However, because MPP inflates the denominator (opens), CTOR figures calculated post-2021 trend artificially lower than historical averages.
Unsubscribe Rate
Unsubscribe rate tracks the percentage of recipients who opt out after receiving a campaign:
(Unsubscribes ÷ Delivered emails) × 100
Unsubscribe rate is an early warning sign for list health issues. A rising trend typically points to one of these causes:
- Content that doesn't match what subscribers expected when they signed up
- Send frequency that feels too high for the audience
- Poor list quality from low-intent acquisition sources
Keeping this rate low protects sender reputation and long-term deliverability.
Average Email Open Rates by Industry
Benchmark figures vary significantly across data sources due to differences in methodology, industry mix, and reporting standards. MailerLite reports a median overall open rate of 43.46% based on 3.6 million campaigns sent between December 2024 and November 2025. GetResponse's mean average is 39.64% from 4.4 billion messages in 2023. Omnisend, focusing heavily on ecommerce, reports 26.6% from 24 billion emails in 2024.
The spread comes down to two factors. Median vs. mean reporting makes a difference — medians (MailerLite) minimize the impact of outliers, while means (GetResponse, Omnisend) can be skewed by exceptionally high or low performers. Audience composition matters too: Omnisend's ecommerce-heavy client base sees lower open rates than mixed-industry ESPs.
Industry-by-Industry Open Rate Benchmarks
| Industry | Mailchimp (2024) | MailerLite (2025) | GetResponse (2024) |
|---|---|---|---|
| Business & Finance | 31.35% | 43.34% | 34.70% |
| Ecommerce/Retail | 29.81% | 32.67% | 41.77% |
| Media & Entertainment | 34.23% | 42.97% | 51.19% |
| Education | 35.64% | 43.98% | 41.33% |
| Nonprofit | 40.04% | 52.38% | 54.54% |
| Healthcare | 34.65% | 43.75% | 43.95% |
| Government | 40.56% | 48.52% | N/A |
| B2B/Professional Services | 32.74% | 45.96% | 47.26% |
Consistent patterns emerge across all three sources:
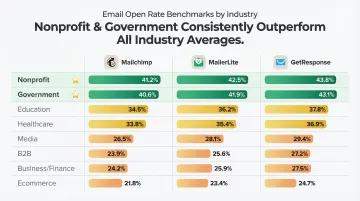
- Nonprofit, Education, and Government consistently outperform cross-industry averages
- Ecommerce and Retail generally underperform, reflecting high promotional volume and subscriber fatigue
- Media & Entertainment and B2B/Professional Services perform above average, driven by content quality and subscriber intent
Why Industry Context Matters
A 30% open rate in retail ecommerce may indicate solid performance, while the same figure in nonprofit fundraising signals underperformance. Benchmark against your specific sector, not generic averages. Industry norms reflect subscriber expectations, competitive email volume, and the nature of the relationship between sender and recipient.
Email Type Matters More Than Industry
Transactional and automated emails significantly outperform broadcast campaigns, even within the same vertical. GetResponse data shows triggered emails achieve 45.38% open rates compared to 40.08% for newsletters. Omnisend reports automated emails hit 42.1% open rates while campaigns languish at 25.2%.
Transactional emails — order confirmations, shipping updates, password resets — arrive when recipients expect them and contain information they actively need. Automated flows trigger based on behavior, so relevance and timing are built in.
Apple MPP Impact on Open Rate Data
Apple MPP pre-loads tracking pixels by routing email content through proxy servers, registering "opens" before users view emails. This technical change inflated reported open rates starting in late 2021.
Practical implications:
- Use open rates for directional trend analysis, not absolute performance measurement
- Prioritize CTR and CTOR as more reliable engagement signals
- Compare performance against your own historical baseline, not pre-MPP industry benchmarks
Newsletter Open Rate Benchmarks
Newsletters differ fundamentally from promotional emails. Where promotional sends prioritize conversion (buy now, claim this offer, register today), newsletters deliver editorial content that subscribers explicitly requested. This intent difference drives measurably higher engagement.
GetResponse reports newsletter open rates of 40.08%, outperforming many promotional categories. Beehiiv's 2025 analysis of 15.6 billion newsletter sends found an average open rate of 37.67%. Substack reports platform-wide averages exceeding 45% for active publications.
What drives newsletter outperformance:
- Readers opted in specifically for the content — not as a byproduct of a purchase or signup
- Consistent publishing standards and verified information build trust over time
- Regular send schedules train readers to expect and look for each issue
- Straightforward, branded subject lines outperform clickbait for sustained open rates
Those factors compound. House of Summary's portfolio of specialized newsletters — covering global news, geopolitics, and city-specific content — is built entirely around this model: verified reporting, consistent cadence, and audiences who opted in for the subject matter. The result is click-through rates 4x higher than Google AdWords for advertisers running placements across the network.
List Size and Niche Targeting
Newsletter performance shifts measurably with list size and targeting precision. GetResponse data reveals smaller lists significantly outperform larger ones:
- 250–499 subscribers: 70.64% open rate
- 1,000–2,499 subscribers: 45.73% open rate
- 5,000–9,999 subscribers: 37.95% open rate
- 100,000+ subscribers: 61.25% open rate — large enterprise publishers often recover performance through aggressive list hygiene, segmentation, and suppression of inactive addresses
Smaller, highly targeted newsletter lists serving niche audiences often achieve 50%+ open rates, while mass-market publications with hundreds of thousands of subscribers may see 30–40% as exceptional. Comparing a 5,000-subscriber specialty newsletter to a 500,000-subscriber general publication is misleading. The former serves a narrow, highly engaged audience; the latter trades targeting depth for scale.
Other Key Email Benchmarks: CTR, CTOR, and Unsubscribe Rates
Click-Through Rate (CTR)
Most industries see CTR between 1-4%, with significant variation based on content relevance and audience quality.
| Source | Overall CTR | Top Performers | Low Performers |
|---|---|---|---|
| MailerLite (2025) | 2.09% | Hobbies (4.36%), Media | Travel, Restaurants |
| GetResponse (2024) | 3.25% | Legal Services (12.11%), Communications (8.66%) | Health & Beauty (2.14%) |
| Omnisend (2025) | 1.22% | Games, Autos | (ecommerce baseline) |
What drives higher CTR:
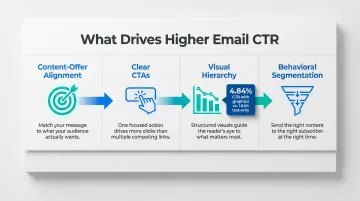
- Content-offer alignment: the link destination matches subscriber expectations set by the email content
- Clear CTAs: specific, action-oriented calls to action outperform vague "learn more" buttons
- Visual hierarchy: GetResponse found emails with graphics achieved 4.84% CTR vs. 1.64% for text-only emails
- Segmentation: targeted sends to behaviorally defined segments consistently outperform batch-and-blast
Click-to-Open Rate (CTOR)
CTOR isolates content quality by measuring engagement only among recipients who opened. However, MPP inflation of the denominator (opens) means post-2021 CTOR figures trend lower than historical baselines.
| Source | Overall CTOR | High Performers | Low Performers |
|---|---|---|---|
| MailerLite (2025) | 6.81% | Manufacturing (14.82%), Legal (14.72%) | Politics (2.96%), Insurance (3.19%) |
| GetResponse (2024) | 8.62% | Legal Services (25.63%), Sports (18.43%) | Health & Beauty (5.62%), Restaurants (6.33%) |
Litmus recommends treating CTOR as a content audit tool rather than a primary KPI. Strong CTOR with moderate open rates often indicates excellent content quality reaching a constrained but highly engaged audience.
Unsubscribe Rate Benchmarks
Healthy unsubscribe rates remain consistently low across industries:
- Mailchimp reports 0.22% average
- MailerLite shows 0.22% median (up from 0.08% in 2024 due to Gmail's simplified unsubscribe features)
- Campaign Monitor cites 0.17% with anything under 2% considered within normal range
Threshold interpretations:
- Below 0.2%: Excellent list health and content-audience fit
- 0.2-0.5%: Good performance, monitor for trends
- 0.5-1%: Average, consider testing content and frequency
- Above 1%: Problem territory requiring immediate investigation
Rising unsubscribe rates typically point to one of three causes:
- Content mismatch — subscribers expected something different from what you're sending
- Frequency issues — you're sending too often for your audience's tolerance
- List quality problems — poor acquisition sources or stale, unengaged contacts
The Engagement Funnel
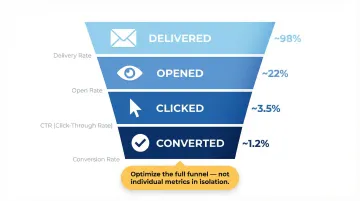
These metrics form a sequential funnel: Delivered → Opened → Clicked → Converted. Optimizing any single metric in isolation creates distortions. High opens with low CTR, for instance, points to subject line clickbait or a disconnect between what the email promises and what it delivers.
Track the full funnel to diagnose specific performance issues rather than chasing individual benchmarks.
What Influences Email Marketing Performance
Subject Lines and Sender Name
Subject lines drive open rate more than any other single factor. GetResponse research shows subject lines under 70 characters achieve the highest open rates (43.38%). Beehiiv found subject lines with 20 or fewer characters averaged 37.6% opens, while those exceeding 80 characters dropped to 28.68%.
Subject line best practices:
- Keep it under 50 characters for mobile preview optimization
- Front-load key information — mobile truncates after 30-40 characters
- Test personalization carefully: GetResponse data shows non-personalized subject lines outperformed personalized ones (41.87% vs. 35.78%), suggesting overuse has diminished effectiveness
- Use emojis sparingly: non-emoji subject lines saw 42.23% opens vs. 37.50% with emojis in GetResponse's dataset
- Add preheader text: emails with preheader text achieved 44.67% opens compared to 39.28% without
Consistent sender names — whether a company name or a personal name — outperform rotating or generic addresses. Subscribers scan the "From" field before they read a single word of the subject line.
Send Timing and Frequency
Day of week patterns:
Campaign Monitor found Monday sees the highest open rates (22%), while Tuesday shows the strongest CTR (2.4%). Beehiiv data confirms Tuesday, Wednesday, and Thursday yield the strongest newsletter engagement. Weekend sends typically underperform, though this varies by industry and audience lifestyle.
Time of day trends:
GetResponse identifies 4–6am and 5–7pm local time as optimal windows. MailerLite's analysis shows emails sent between 3pm and 7pm get the most opens. Morning sends (8–10am) capture early inbox checkers, while evening sends (5–7pm) reach end-of-workday readers.
Critical caveat: Audience-specific testing always trumps industry averages. B2B audiences behave differently than consumer segments. Test your specific list before committing to a schedule.
Frequency balance:
- Too frequent: drives unsubscribe spikes and list fatigue
- Too infrequent: causes disengagement and "who is this?" responses
- Optimal: varies by audience expectations set during signup
List Quality and Segmentation
A small, engaged list of 5,000 active subscribers consistently outperforms a bloated list of 50,000 inactive contacts. The practices below determine which side of that gap you're on.
List hygiene practices:
- Double opt-in confirmation filters low-intent signups
- Remove inactive subscribers regularly (no engagement in 6+ months)
- Run re-engagement campaigns before permanent removal
- Sunset policies automatically remove chronic non-openers
Segmentation impact:
Behavioral segmentation — based on purchase history, engagement level, or content preferences — produces measurably better results than broadcast sends. Klaviyo data shows AI-powered product recommendations lift email click rates to 3.75% average, reaching 8.79% for top performers.
Technical Factors and Deliverability
Authentication protocols directly affect whether emails reach the inbox at all. If messages land in spam, open and click rates will be artificially depressed regardless of content quality.
Essential authentication:
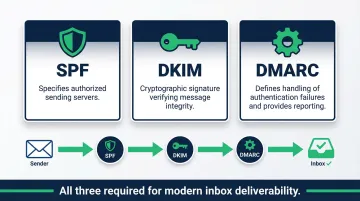
- SPF (Sender Policy Framework): Specifies which mail servers can send on behalf of your domain
- DKIM (DomainKeys Identified Mail): Adds a cryptographic signature verifying the message hasn't been altered
- DMARC (Domain-based Message Authentication): Defines how receivers should handle authentication failures and provides reporting
M3AAWG (Messaging, Malware and Mobile Anti-Abuse Working Group) recommends implementing all three protocols to meet modern "no auth, no entry" deliverability standards. Major inbox providers increasingly require proper authentication to avoid spam filtering.
Sender reputation factors:
- Complaint rates (spam reports)
- Bounce rates (invalid addresses)
- Engagement history (opens and clicks)
- List quality signals (spam trap hits)
Low engagement damages sender reputation, creating a feedback loop: poor metrics lead to more aggressive spam filtering, which depresses metrics further. Treat list hygiene and segmentation as deliverability maintenance, not optional improvements.
Frequently Asked Questions
What is the average open rate for email newsletters?
GetResponse reports newsletter open rates of 40.08%, while Beehiiv's analysis of 15.6 billion sends shows 37.67%. Newsletter open rates generally outperform promotional emails by 5-15 percentage points due to subscriber intent and editorial focus.
What is a good open rate for a newsletter?
A good newsletter open rate typically falls between 30-50% for well-maintained lists, with smaller niche newsletters often exceeding 50%. Compare performance against both your own historical baseline and your specific industry average: a 35% rate may be excellent in one vertical and mediocre in another.
What's the best day of the week and time to send a newsletter?
Research consistently shows Tuesday through Thursday as top-performing days, with send times around 8-10am and 5-7pm (local time) seeing higher opens. However, testing with your specific audience delivers more reliable optimization than following general benchmarks—B2B and B2C audiences behave differently.
What is a good click-through rate (CTR) for email marketing?
A healthy CTR typically ranges between 2-5% depending on industry, with content relevance, clear CTAs, and audience segmentation driving above-average performance. Legal services and communications sectors can reach 8-12% CTR, while most industries cluster in the 2-4% range.
How do I calculate my email open rate?
Use the formula: (unique opens ÷ delivered emails) × 100. Unique opens count individual subscribers who opened; total opens include repeat views from the same person. Most platforms report unique open rate by default.
What is a good unsubscribe rate for email?
An unsubscribe rate below 0.5% per campaign is considered healthy. Rates consistently above 1% signal a content relevance or frequency problem worth investigating. Track trends over time rather than obsessing over individual campaign spikes—seasonal content shifts can cause temporary increases.