Introduction
Open rate data is everywhere. Every platform publishes benchmarks, every blog post offers targets, and yet most marketers still struggle to answer a deceptively simple question: is my campaign actually performing well?
The number alone doesn't tell you much. A 25% open rate might be excellent in one industry and mediocre in another. And thanks to Apple's Mail Privacy Protection — which has inflated reported open rates across the board since 2021 — the figure you see in your dashboard may not reflect reality at all.
This guide cuts through the noise. You'll find a clear breakdown of what open rates actually mean, current benchmarks by industry, why the metric is becoming less reliable (and what to track instead), and the specific levers that drive real engagement — whether you're running your own campaigns or evaluating newsletter advertising as a placement channel for your brand.
Key Takeaways
- Open rate formula: Unique opens ÷ delivered emails × 100
- Industry average: ~21.5% (Campaign Monitor, 2021); Mailchimp's 2023 figure of 35.63% is inflated by Apple MPP
- Better metrics: Pair open rate with CTOR (avg. 10.5%) and CTR (avg. 2.3%)
- Biggest levers: Subject line, list segmentation, sender reputation, and send timing
- Curated newsletters typically outperform standard marketing emails on engagement
What Is an Email Open Rate and How Is It Calculated?
The formula is straightforward:
Open Rate = (Unique Opens ÷ Delivered Emails) × 100
Notice the denominator is delivered emails — not sent. Bounced emails never reach a recipient's inbox, so including them would artificially deflate your rate and misrepresent actual reach.
Unique Opens vs. Total Opens
These two figures often get confused, and they measure very different things:
- Unique opens count each recipient once, regardless of how many times they opened the email
- Total opens count every instance — so one reader opening an email three times registers as three total opens
For benchmarking, unique opens are the meaningful number. Total opens can be useful for understanding re-read behavior, but comparing total opens across campaigns or publishers introduces too much noise.
How Tracking Actually Works
Most email platforms — HubSpot, Mailchimp, Campaign Monitor — track opens by embedding an invisible one-pixel image in each email. When that image loads, the platform records an open.
This method has a fundamental limitation: it depends entirely on image loading. If images are blocked, real opens go unrecorded. Apple's Mail Privacy Protection takes this further — it pre-loads images automatically, recording opens whether or not anyone actually read the email. That means your open rate data can overcount just as easily as it undercounts. Knowing this shapes how you should interpret benchmarks in the sections ahead.
What Is a Good Email Open Rate?
There's no single universal target, but benchmarks give useful context.
Campaign Monitor's 2022 benchmark report, based on analysis of over 100 billion emails, puts the all-industry average at 21.5%. Mailchimp's December 2023 data shows a higher 35.63% average — a gap driven partly by Apple's Mail Privacy Protection inflating reported rates. Neither number should be used without that context.
A Simple Performance Framework
| Open Rate Range | What It Signals |
|---|---|
| 30%+ | Strong performance — above average for most industries |
| 20–30% | Solid, around industry average — room to optimize |
| Below 15% | Warrants attention — check list quality, subject lines, and deliverability |
Use this as orientation, not a scorecard. Your industry benchmark matters far more than any universal figure.
Email Type Makes a Difference
Not all emails are created equal when it comes to open rates:
- Transactional emails (receipts, confirmations, account alerts) consistently outperform marketing emails — recipients expect and want them
- Promotional campaigns tend to land at the lower end, especially with high send frequency
- Curated subscription newsletters often sit above standard marketing averages, because the audience actively opted in for specialized content
For advertisers, that last point has real implications. When readers choose a newsletter specifically for its topic — finance, geopolitics, city-level business news — they arrive with intent. That self-selection produces higher baseline engagement than a broadly assembled marketing list, because readers aren't passive recipients; they're active consumers of that subject matter.
House of Summary's network illustrates this directly. With over 500,000 subscribers across Presidential Summary, Geopolitical Summary, Dubai Summary, and London Summary, each publication draws readers who opted in for professional relevance in a specific domain — the kind of engaged audience that moves open rate benchmarks meaningfully above industry averages.
Email Open Rate Benchmarks by Industry
Industry context is everything. Comparing your retail campaign to a nonprofit newsletter benchmark tells you nothing useful. The right peer group is your own vertical.
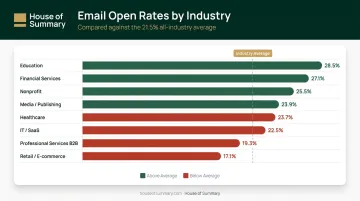
The table below draws from Campaign Monitor's 2022 benchmark report, which analyzed over 100 billion emails sent in 2021:
| Industry | Open Rate | vs. 21.5% Average |
|---|---|---|
| Education | 28.5% | Above average |
| Financial Services | 27.1% | Above average |
| Media, Entertainment & Publishing | 23.9% | Above average |
| Healthcare Services | 23.7% | Above average |
| IT/Tech/Software (SaaS) | 22.5% | Above average |
| Nonprofit | 25.5% | Above average |
| Professional Services (B2B) | 19.3% | Below average |
| Retail/E-commerce | 17.1% | Below average |
Why the Gaps Exist
Education and Nonprofit readers open because the content genuinely matters to them — mission-driven material carries inherent urgency. Financial Services performs similarly well: market information has direct professional and financial consequence, so subscribers pay attention.
Retail sits at the other end for structural reasons. Higher send frequency drives fatigue, and when promotional emails arrive daily, open rates erode. The content also skews transactional rather than informational, which reduces the perceived urgency to open at all.
One-Time Campaigns vs. Automated Flows
Benchmark context extends beyond industry. The type of email changes the numbers significantly:
According to Klaviyo's 2026 benchmark data across more than 183,000 brands, automated behavior-triggered flows dramatically outperform one-time campaign sends:
- Click rate: 5.58% for flows vs. 1.69% for campaigns
- Placed order rate: 2.11% for flows vs. 0.16% for campaigns
Triggered emails capture higher-intent moments — an abandoned cart, a recent purchase, a specific behavior signal. A weekly editorial newsletter occupies different territory: consistent value delivery to a self-selected audience. Use each benchmark only against its own category, or the comparison will mislead more than it informs.
Why Open Rates Are Becoming Less Reliable — And What to Track Instead
Open rates were always imperfect. Apple made them more so.
The Apple MPP Problem
Apple's Mail Privacy Protection launched on September 20, 2021. The mechanism: Apple routes emails through a proxy server and pre-loads all content, including tracking pixels, at indeterminate intervals — regardless of whether the recipient actually opens the email.
The result is open rate inflation. Every Apple Mail user registers as an "open" whether they read the email or not. Given that Litmus reports Apple's email client market share at 45.51% as of February 2026, this isn't a minor distortion — it affects nearly half of all email opens tracked.
Other Sources of Distortion
- Security bots: Corporate security systems scan incoming emails for malicious content, sometimes triggering opens before a human sees anything
- Image blocking: When recipients disable images, the tracking pixel never loads — real opens go unrecorded
- Preview panes: Some email clients render content in a preview window, potentially loading the pixel without a deliberate full open
What to Track Instead
Open rate still has directional value, particularly for relative testing within the same list. It shouldn't be your primary engagement signal, though. The metrics below give a sharper read on actual audience response:
| Metric | Formula | Industry Average | What It Measures |
|---|---|---|---|
| CTOR (Click-to-Open Rate) | Unique Clicks ÷ Unique Opens × 100 | 10.5% | Whether content delivered on the subject line's promise |
| CTR (Click-Through Rate) | Unique Clicks ÷ Delivered Emails × 100 | 2.3% | Overall campaign reach and response across the full list |
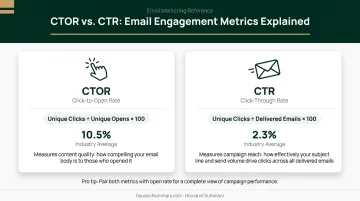
Use open rate directionally, pair it with CTOR and CTR, and add unsubscribe rate for a complete engagement picture. Advertisers evaluating newsletter placements should ask for all four metrics, not just an open rate headline.
Key Factors That Influence Email Open Rates — and How to Improve Them
Subject Lines
The subject line is decided before anything else is seen. It's the single biggest lever on open rates.
Practical guidelines backed by data:
- Keep it concise: Mailchimp recommends no more than 9 words and 60 characters
- Personalize: Campaign Monitor data shows personalized subject lines are 26% more likely to be opened
- Avoid spam signals: All caps, multiple exclamation points, and trigger phrases route emails to spam folders before any human decision is made
- Lead with value or curiosity — vague subject lines get skipped; specific ones earn opens
Sender Name and Reputation
Recipients open emails from senders they recognize. A consistent sender name builds familiarity over time; sudden changes cause temporary dips that take weeks to recover.
Sender reputation also determines whether emails reach the inbox at all. A positive reputation means better deliverability — your email lands in the primary inbox rather than promotions or spam. Warm up new domains gradually, maintain low bounce and complaint rates, and monitor spam traps to protect that standing.
Send Timing and Frequency
Campaign Monitor's 2022 data shows Monday had the highest open rate (22.0%) and Tuesday the highest CTR (2.4%). Industry guidance points to Tuesday through Thursday as strong windows — but optimal timing depends on your audience.
On frequency: sending too often drives fatigue and unsubscribes; too infrequently means readers forget who you are. Campaign Monitor considers unsubscribe rates under 0.2% healthy. If you're consistently above that threshold, it's a signal to either reduce send frequency or tighten your segmentation before the problem compounds.
List Quality and Segmentation
Timing and frequency matter less when you're broadcasting to the wrong people. A bloated list with inactive subscribers doesn't just produce poor open rates — it damages sender reputation and deliverability scores over time.
Two practices make the biggest difference:
- Regular list cleaning: Remove inactive subscribers every 3–6 months. Mailchimp recommends cleaning at least every 6 months; for high-volume senders, quarterly is better
- Segmentation by behavior and interest: HubSpot's 2023 State of Marketing data shows segmented emails drive 30% more opens and 50% more clickthroughs than unsegmented sends
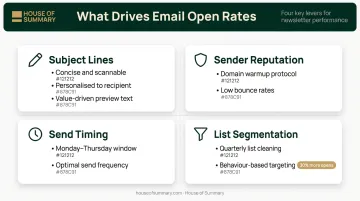
For advertisers, this logic applies when evaluating newsletter partners too. A publisher that actively manages list hygiene and segments by reader behavior offers a higher engagement floor than one with a large but unfiltered list. House of Summary tracks both total readers and loyal readers — those who open multiple times per month — as distinct signals of audience health.
Frequently Asked Questions
What is a good open rate for a newsletter?
Curated subscription newsletters typically reach 30–40%+ for high-quality publications with engaged, opt-in audiences. The key driver is self-selection: readers who subscribe to a specific topic are far more likely to open than subscribers on a broadly assembled list.
What is the average email open rate across all industries?
Campaign Monitor's 2022 benchmark report (using 2021 data) puts the all-industry average at 21.5%. Mailchimp's more recent 2023 data shows 35.63% — though both sources note that Apple's Mail Privacy Protection has inflated reported rates, so any current figure should be interpreted with that caveat.
Why are email open rates less reliable than they used to be?
Apple's Mail Privacy Protection pre-loads tracking pixels through a proxy server, registering opens regardless of whether anyone actually read the email — and with Apple holding nearly 46% of email client market share, that distortion is significant. Security bots and image-blocking compound the problem, making CTOR and CTR more reliable indicators.
What is click-to-open rate (CTOR) and why does it matter?
CTOR measures the percentage of openers who clicked a link. Unlike open rate, it tests whether your content matched the expectation set by the subject line — making it a measure of content quality rather than deliverability, with an industry average of 10.5%.
How often should I clean my email list to maintain good open rates?
Remove inactive subscribers every 3–6 months — quarterly if you send at high volume. A smaller, active list consistently outperforms a large, disengaged one on both open rates and deliverability, since high bounce and low-engagement signals damage sender reputation over time.
What day of the week gets the highest email open rates?
Campaign Monitor data points to Monday for the highest open rate and Tuesday for the highest click-through rate. Mid-week (Tuesday–Thursday) is widely cited as the strongest window, but optimal send day varies by audience. A/B testing with your specific list will outperform any general industry recommendation.