
Brand lift fills that gap. It measures the change in consumer attitudes caused by ad exposure — comparing people who saw your campaign against those who didn't. Done correctly, it answers the question clicks never can: did this campaign actually move the needle?
This guide walks through everything you need to run a brand lift study: the preconditions, three measurement methods, the metrics that matter, how to interpret results, and the mistakes that quietly invalidate studies before they even finish.
Key Takeaways
- Brand lift compares an exposed group vs. a control group to measure perception change caused by advertising
- Track ad recall, brand awareness, consideration, and purchase intent — along with absolute, relative, and headroom lift — to get a complete picture
- Choose from DIY survey studies, platform-native tools (YouTube, Meta, TikTok), or third-party brand trackers depending on budget and scale
- Sample size determines what you can detect: a 1% absolute lift requires 20,000–45,000 survey responses on DV360
- Interpret results by metric, audience segment, and funnel stage — never as a single headline number
What You Need Before Running a Brand Lift Study
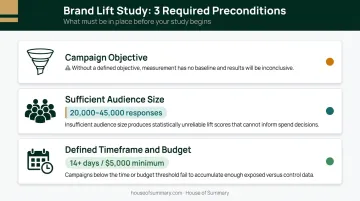
Get these three things right before you configure a single survey question — skipping any one of them will compromise your results.
1. A campaign objective tied to a funnel stage. Are you measuring awareness, consideration, or purchase intent? Measuring intent for a top-of-funnel campaign will produce misleading "no lift" signals even if the creative worked perfectly.
2. A sufficient audience size. Brand lift studies require statistical confidence, which means responses — a lot of them. DV360's documented thresholds show that detecting a 1% absolute lift requires 20,000–45,000 total survey responses. Small campaigns often can't reach this threshold within their run time.
3. A defined timeframe with sufficient impressions. Most platforms require at least 14 days of run time. Google Ads Standard Brand Lift, for example, requires a minimum budget of $5,000 for a single-question study in Tier A countries — shorter or smaller campaigns rarely hit the response thresholds needed for reliable data.
Tools and Inputs Required
Before launch, assemble:
- A defined target audience and segmentation plan to split exposed and control groups
- Survey questions aligned to your chosen metric (1–2 focused questions per metric)
- Access to a measurement platform — Google Ads, DV360, Meta Ads Manager, TikTok Ads Manager, or a third-party provider
- A pre-campaign baseline for the metric you're tracking (without this, you cannot calculate lift)
Control Group Integrity
The control group must be excluded from the campaign but otherwise identical to the exposed group in demographics and behavior. Contamination — from retargeting lists, prior campaign exposure, or lookalike overlap — invalidates results. Verify this before launch, not after.
Three Methods to Measure Brand Lift
All three methods share the same logic: compare exposed vs. unexposed audiences. They differ in execution, cost, and precision — and they roughly escalate in that order, from a manual DIY setup to automated platform tools to ongoing third-party tracking. Choose based on your budget, campaign scale, and how much control you need over the methodology.
Method 1: DIY Survey Study
How it works: You design and distribute a short survey to both your exposed audience and a matched control group. Responses are compared to calculate lift percentage.
Tools needed: A survey platform (SurveyMonkey, Typeform, or similar), a CRM or ad platform that can identify who was and wasn't exposed, and a statistical significance calculator.
Steps:
- Define one metric to measure and write 1–2 survey questions tied specifically to that metric — avoid compound questions
- Deploy surveys to both groups within a consistent window after campaign exposure ends
- Calculate absolute lift: Exposed Group Positive Rate − Control Group Positive Rate
- Verify statistical significance before drawing any conclusions
Pros:
- Full control over question design and timing
- No platform dependency
Cons:
- Manual exposure verification is difficult
- Selection bias risk if groups aren't properly matched
- Smaller campaigns frequently can't generate statistically significant sample sizes
Method 2: Platform-Native Brand Lift Tools
How it works: Platforms like YouTube (via Google Ads or DV360), Meta, and TikTok automate control group creation, survey delivery, and data collection within their ecosystems.
Tools needed: Google Ads, DV360, Meta Ads Manager, or TikTok Ads Manager with Brand Lift study features enabled. Note: TikTok Brand Lift Studies can only be set up through a TikTok account manager. Meta and TikTok have minimum budget requirements that vary by country and account configuration.
Steps:
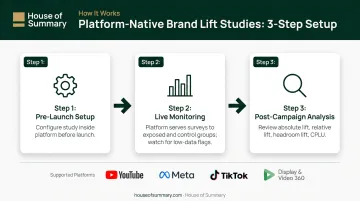
- Set up the brand lift study inside the platform before the campaign launches — select the brand entity and the survey metric (ad recall, awareness, consideration, etc.)
- Let the platform automatically serve surveys to a statistically valid sample of exposed users and a withheld control group throughout the campaign; monitor for "not enough data" flags
- Post-campaign, review absolute lift, relative lift, headroom lift, lifted users, and cost per lifted user
- Cross-reference against spend to evaluate efficiency alongside magnitude
Pros:
- Automated, statistically rigorous control group creation
- Deeply integrated with campaign data
Cons:
- Each platform only measures what runs inside it
- Methodology is proprietary
- Minimum budget thresholds exclude smaller campaigns
Method 3: Third-Party Brand Tracking
How it works: An independent research provider surveys your target audience at regular intervals — monthly or quarterly — tracking brand metrics over time, independent of any single campaign.
Tools needed: A third-party research firm such as Nielsen, Kantar, or Dynata; historical brand metric data to establish baselines; the ability to isolate campaign timing windows within the tracker data.
Steps:
- Brief the provider on your brand, competitors, and the attributes to track (awareness, favorability, purchase intent) — agree on survey cadence and audience definition before launch
- Run the tracker continuously so pre-campaign baselines exist before launch; after the campaign ends, compare the wave captured during or after exposure against the pre-campaign benchmark
- Look for statistically significant shifts during the campaign period; cross-reference with sales data and search volume to strengthen attribution confidence
Pros:
- Longitudinal data and continuous trending that platform-native tools can't provide
- Competitive context included
Cons:
- More expensive and slower to yield results
- Harder to isolate the effect of a single specific campaign
Key Metrics to Track in a Brand Lift Study
Brand lift is not one number. It's a system of metrics, each corresponding to a different stage of the purchase funnel.
Ad Recall
Measures how many people remember seeing the ad after exposure. This is the most accessible upper-funnel metric and typically the first to respond when a campaign runs. Meta's methodology estimates recall if people are asked within two days of exposure — a narrow window that reflects how quickly recall fades. Nielsen's 2023 emerging media analysis found that brand recall accounted for 38.7% of total brand lift impact, making it the single largest driver in the model.
Use ad recall when your campaign objective is attention and visibility — not as a proxy for deeper brand health.
Brand Awareness and Familiarity
Measures whether consumers recognize the brand name or associate it with a product category. This metric is appropriate for new product launches and new market entries, where the baseline is genuinely low and movement is easier to detect.
For context on what strong performance looks like: Google Preferred YouTube campaigns in Think with Google's research drove an average 17% lift in brand awareness, with 65% of those campaigns showing measurable increases. Newer brands can expect larger movements; established brands with high baseline awareness will see smaller absolute gains, which is expected rather than a failure.
Brand Consideration and Purchase Intent
Consideration measures whether consumers would include your brand in their decision set. Purchase intent goes one step further and indicates likelihood to buy. Both are mid-to-lower funnel metrics and should only be used when the campaign was specifically designed to drive them.
Measuring purchase intent for a pure awareness campaign will almost always show "no lift." That result signals a metric mismatch, not a campaign failure.
Absolute Lift, Relative Lift, and Headroom Lift
These three technical metrics work together. Using only one will mislead you.
| Metric | Definition | Example |
|---|---|---|
| Absolute Lift | Exposed positive rate − Control positive rate | Exposed: 20%, Control: 10% → +10 p.p. |
| Relative Lift | Absolute lift ÷ Control positive rate | +10 p.p. ÷ 10% baseline → +100% |
| Headroom Lift | Absolute lift ÷ (1 − Control positive rate) | +10 p.p. ÷ 90% remaining → +11.1% |
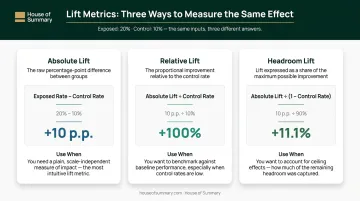
Headroom lift is particularly useful when comparing campaigns across brands with very different baseline awareness levels. A brand at 80% awareness has little room to grow; a brand at 20% has substantial headroom. Headroom lift normalizes for this difference.
Cost Per Lifted User (CPLU)
Formula: Total Campaign Cost ÷ Estimated Number of Lifted Users
CPLU reveals how efficiently a campaign changed individual perceptions. Consider two media buys:
| Campaign | Spend | Absolute Lift | Reach | Lifted Users | CPLU |
|---|---|---|---|---|---|
| Campaign A | $50,000 | 15% | 100,000 | 15,000 | $3.33 |
| Campaign B | $50,000 | 5% | 500,000 | 25,000 | $2.00 |
Campaign A produced a higher percentage lift. Campaign B changed more minds at a lower cost per person. Which matters more depends on your objective — but making that call requires seeing both figures together.
How to Interpret Your Brand Lift Results
Misreading results is common and costly. Here's how to handle each outcome correctly.
Strong Lift Detected
When the exposed group's positive response rate significantly exceeds the control group's, the campaign shifted perception. Next steps:
- Identify which creative, channel, or audience segment drove the highest lift
- Prioritize those variables in future campaign planning
- Note that even a +3 p.p. absolute lift can represent a strong result for an established brand with high baseline awareness — context matters more than the raw number
Weak or No Lift Detected
"No lift" is a diagnostic starting point, not a final verdict. Work through these checks in order:
- Sample size — were there enough survey responses to detect the expected lift magnitude?
- Metric alignment — did the metric match the campaign's actual funnel stage?
- Creative quality — was the messaging persuasive enough to shift that perception?
- Control group contamination — was the control group accidentally exposed through retargeting or prior campaigns?
If all four check out and lift is still undetected, the campaign may genuinely not have moved that metric. That's a finding worth acting on — redirect spend toward the metrics that are moving.
Segmentation Reveals Hidden Insights
Overall results mask what's actually happening. A campaign showing +2% average lift may be delivering +12% among 18–24 year olds and 0% among 35–44 year olds.
Segment-level analysis is where the sharpest optimization signals are. Break results down by:
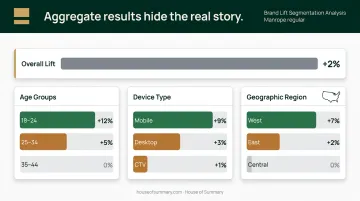
- Age and gender
- Device type
- Geographic region
Never stop at the aggregate.
Linking Lift to Business Outcomes
Brand lift results need business context to justify budget decisions. Research cited by Think with Google, drawing on Google/WARC data, found that returns in the first four months of a campaign equal the returns generated across the subsequent 20 months. That makes brand lift a leading indicator of long-term revenue, not a vanity metric. The same source cites Nielsen research finding that a 1% increase in brand awareness leads to a 0.4% increase in short-term sales and a 0.6% increase in long-term sales.
When presenting to leadership, connect the numbers to revenue. A +8 p.p. awareness gain carries far more weight when paired with what that shift has historically meant for pipeline.
Common Mistakes and Best Practices
Common Mistakes
Wrong metric for the funnel stage. Measuring purchase intent for a brand awareness campaign produces misleading "no lift" results. Align the metric to the objective before the study is configured — not after.
Insufficient sample size. Google flags results below 4,100 survey responses as having low measurement power. DV360 requires 20,000–45,000 responses to detect a 1% absolute lift, and over 180,000 responses to detect lifts below 0.5%. Short campaigns or small budgets frequently can't clear these thresholds.
Leading with relative lift. A +60% relative lift sounds transformational. If the baseline was 5%, the absolute lift is +3 p.p. Report both figures together; never let relative lift be the headline number.
Most of these mistakes share a root cause: decisions made after the fact rather than baked into the study design. The practices below address that directly.
Best Practices
Define success before launch. State in advance what a positive result looks like — for example, "We expect +5 p.p. lift in brand awareness among adults 25–44." This prevents post-hoc rationalization and keeps the study design focused.
Choose high-engagement, low-interference channels. The Havas/Lumen/Brand Metrics study of 9,089 brand lift campaigns found that 2.5 seconds of aggregate attention is the minimum threshold to drive significant brand outcomes. Channels where every impression is reliably delivered — no ad blockers, no algorithmic filtering, no open-web auction noise — produce cleaner exposed vs. control comparisons and more defensible lift results.
Report results with business context. Present brand lift alongside revenue implications — estimate what historical data suggests a +10% awareness gain means for future purchase behavior and pipeline. This is the framing that justifies brand investment to leadership who measure success in revenue.
Frequently Asked Questions
How do you calculate brand uplift?
Brand uplift is calculated by subtracting the control group's positive response rate from the exposed group's positive response rate. The formula: Absolute Lift = Exposed Group Rate − Control Group Rate. If 30% of exposed respondents recalled your brand versus 20% in the control group, absolute lift is +10 p.p.
What is a good brand lift result?
There's no universal benchmark — "good" depends entirely on baseline awareness, market, and campaign objective. A +3 p.p. lift can be a strong outcome for a well-known brand already at 70% awareness, while a newer brand might reasonably expect movements of +10 p.p. or more.
What is the difference between absolute lift and relative lift?
Absolute lift is the raw percentage point difference between groups (e.g., +10 p.p.). Relative lift expresses that difference as a percentage of the baseline — if the baseline is 10% and exposed is 20%, relative lift is +100%. Both are needed; neither tells the full story alone.
How many survey responses do you need for a brand lift study?
It depends on the size of lift you're trying to detect. On DV360, detecting a 3% absolute lift requires 2,800–5,000 responses; detecting a 0.5% lift requires 45,000–180,000 responses. Smaller lifts require far more responses to reach statistical significance.
How long does a brand lift study take?
A brand lift study runs alongside the campaign until enough responses accumulate — typically several weeks. Google Ads Standard Brand Lift completes within 14 days; very short or low-budget campaigns may not produce valid results within that window.
Can brand lift be measured on channels other than YouTube?
Yes. Brand lift studies run on Meta, TikTok, connected TV, DV360 programmatic display, and newsletter/email advertising. The exposed vs. control methodology stays consistent across channels, though minimum requirements and verification quality vary by platform.