
Introduction
Modern advertisers face a paradox: more data exists than at any point in history, yet 40% of every dollar spent in the open CTV programmatic market is wasted due to inaccurate targeting. The problem isn't data scarcity—it's the absence of a disciplined strategy to use it effectively.
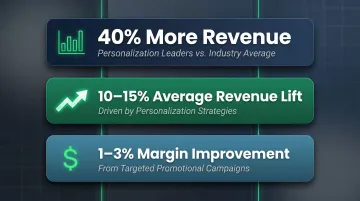
The difference between campaigns that consistently deliver ROI and those that burn through budgets comes down to one discipline: using customer data to inform every decision — audience selection, ad placement, message timing, and creative execution. Companies that excel at personalization generate 40% more revenue from those activities than average players.
This guide covers what data-driven advertising means, the four data types that matter most, a step-by-step strategy framework, best practices for cutting waste, and how to measure campaign performance accurately.
TLDR:
- Data-driven advertising uses behavioral, demographic, and intent signals to target qualified audiences with relevant messages
- First-party and intent data outperform third-party data, which hovers at just 45% accuracy
- Narrow targeting often requires unrealistic performance lifts; quality beats audience size
- Multi-touch attribution reveals paid search is typically overvalued by 40-65%
- Newsletter advertising delivers up to 10x higher engagement than traditional display ads
What Is Data-Driven Advertising?
Data-driven advertising uses real customer data—behavioral signals, demographics, purchase history, and engagement patterns—to decide who sees your ads, where, and with what message. Every placement is a deliberate choice backed by evidence, not instinct.
This contrasts sharply with traditional "spray and pray" advertising—billboards, broad TV spots, untargeted display—which trades on reach over relevance. Data-driven advertising flips that logic: reach fewer people, but the right ones, with messages that actually land.
The performance gap is substantial. 85% of CMOs agree that making data-driven decisions is a critical competitive advantage. A McKinsey case study demonstrated that pivoting to personalized, data-driven marketing produced an additional $150 million in value over a single year for one North American retailer.
That retailer isn't an outlier. Across industries, the benchmarks are consistent:
- Personalization drives a 10–15% revenue lift on average
- Targeted promotional campaigns deliver a 1–2% sales lift and 1–3% margin improvement
- The gap between data-driven and non-data-driven advertisers widens with each campaign cycle
The 4 Types of Data That Power Effective Ad Campaigns
First-Party Data
First-party data is information collected directly by a brand from its own channels—website behavior, email engagement, CRM records, purchase history. Because it reflects actual interactions with your brand and sits outside third-party signal loss, it consistently outperforms other data sources in targeting accuracy.
The strategic shift to first-party data responds to legislation and signal loss, offering companies a way to maintain high-quality consumer interactions and ensure compliance with privacy laws.
Second-Party Data
Second-party data is shared through direct partnerships with other organizations—for example, a brand partnering with a publisher to access their audience insights. This expands reach without sacrificing data quality, since the source is known and trusted.
Third-Party Data
Third-party data is aggregated data purchased from external data brokers or sourced from public repositories. It can broaden audience targeting, but the quality tradeoffs are significant:
- Broad demographic data accuracy sits at just 45%, with IP-to-Postal linkages accurate only 13% of the time
- IP-to-Email matching fares little better at 16% accuracy
- These gaps are projected to waste $7.36 billion in U.S. CTV ad spend in 2026 alone
It's no surprise, then, that 68% of marketers are reevaluating their third-party data partnerships.
Behavioral and Intent Data
Behavioral and intent data includes signals derived from what users actively do—search queries, content consumed, pages visited, time spent, videos watched. Intent data is among the most actionable because it reflects what an audience is interested in right now, not just who they demographically are.
Google research shows that marketers relying solely on demographics risk missing more than 70% of potential mobile shoppers. For example, 69% of mobile searchers for video games fall outside the traditional 18-34 male demographic.
Quality Over Volume
A small, verified, high-intent audience dataset will consistently outperform a massive but noisy one. Volume creates the illusion of reach; quality drives actual results. When evaluating channels, prioritize those where engagement signals are clean and audiences are demonstrably in-market—not just large.
How to Build a Data-Driven Advertising Strategy
Step 1: Define Clear Campaign Goals and KPIs
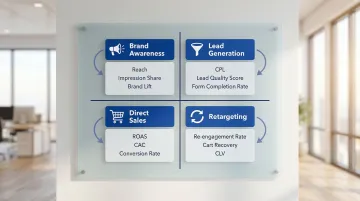
Every data-driven campaign must begin with a clearly stated objective—brand awareness, lead generation, direct sales, or retargeting—because the goal determines which data to collect, which audiences to target, and which metrics to optimize for.
How different goals map to KPIs:
- Brand awareness → Reach, impression share, brand lift
- Lead generation → Cost per lead (CPL), lead quality score, form completion rate
- Direct sales → Return on ad spend (ROAS), cost per acquisition (CAC), conversion rate
- Retargeting → Re-engagement rate, abandoned cart recovery, customer lifetime value (CLV)
Step 2: Identify, Collect, and Unify the Right Data
Audit existing data sources first—CRM records, website analytics, email platforms, and past campaign reports—before seeking external data. When data lives across disconnected tools and departments, teams lose visibility into both audience behavior and campaign performance.
The cost is measurable: poor data quality costs organizations at least $12.9 million annually on average. Agencies cite client data silos as the top driver of media waste, with 71% of advertisers spending $1 billion+ annually describing their data environments as "chaotic."
Step 3: Segment Audiences Based on Data Signals
With clean, unified data in place, segmentation becomes far more precise. Audience segmentation uses behavioral, demographic, and intent data to divide a broad target audience into specific, addressable groups.
How segmentation changes ad messaging:
- Price-sensitive segments respond to "most affordable" or value-focused messaging
- Premium segments respond to exclusivity and quality cues
- High-intent cart abandoners need urgency-driven recovery offers
- New visitors need educational content before any sales pitch
Step 4: Choose Channels Where Your Audience Data Is Strongest
Channel selection should be guided by where your audience's data signals are clearest and their intent is highest—not simply where reach is largest.
Some channels (programmatic display, social feeds) offer scale but suffer from ad fatigue, banner blindness, and ad blockers. Newsletter advertising represents a channel with exceptionally high signal quality: readers who subscribe to specialized newsletters demonstrate strong topical intent.
Channel performance comparison:
| Channel | Metric | Benchmark |
|---|---|---|
| Email/Newsletter | Open rate | 2.62%–35.63% |
| Search Ads | CTR | 3.17% |
| Display Ads | CTR | 0.46% |
Sources: Mailchimp 2023, StoreGrowers
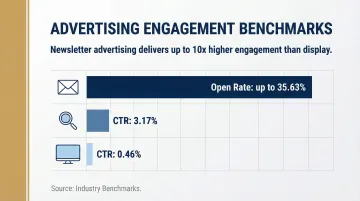
Newsletter advertising can achieve up to 10x higher engagement rates than traditional display ads because subscribers are actively consuming content in a trusted environment, making them more receptive to relevant ads.
House of Summary's newsletter network puts this into practice: ads reach decision-makers and global executives in their inboxes, where there are no algorithms filtering content, no ad blockers, and no competing visual clutter.
Step 5: Build Personalized Ad Creatives Aligned to Each Segment
Data only creates value when it directly shapes the message. Use audience data to write copy, select visuals, and craft offers that speak to a specific segment's pain points or interests.
Examples of data-driven creative personalization:
- Past purchasers receive cross-sell offers for complementary products
- Cart abandoners see the exact items they left behind, paired with urgency messaging
- High-value customers get early access or VIP offers unavailable to the general list
- Geographic segments see location-specific inventory or regional pricing
Each of these tactics requires the same foundation: data that is clean, unified, and mapped to specific audience behaviors before a single creative asset is built.
Best Practices for Data-Driven Ad Campaigns
Use Predictive Analytics to Reduce Ad Waste
Predictive models using historical behavioral data and AI can forecast which audience segments are most likely to convert. This allows advertisers to concentrate budget where probability of return is highest rather than spreading it evenly.
AI benefits the advertising process by predicting which audiences, creatives, and bids are likely to outperform, mitigating the risk of wasted ad spend. AI also enables marketers to run Marketing Mix Models 2-3x more often, shifting from annual runs to monthly or real-time optimization.
A/B Test Systematically and Let Data Decide
Every assumption about ad creative, headline, CTA, or targeting parameter should be treated as a hypothesis and tested against real audience behavior. The goal is not to test everything at once but to isolate variables so data produces clear, actionable conclusions.
Test one variable at a time:
- Headline A vs. Headline B (same image, same CTA)
- CTA placement top vs. bottom (same copy, same creative)
- Audience segment 1 vs. segment 2 (same ad)
Refresh Data Regularly to Avoid Targeting Decay
Audience behavior shifts over time, and campaigns built on stale data will gradually misfire. The IAB recommends using quick refreshes (weekly input refresh plus dashboards) and separate full model retrains (monthly or quarterly, based on stability).
Frequent refreshes keep numbers timely, while less-frequent retrains preserve model stability.
Prioritize Audience Quality Over Audience Size
Targeting a smaller, highly engaged, well-matched audience almost always outperforms targeting a larger but less relevant one, especially when CAC and ROAS are the benchmarks.
Research shows roughly half of audience segments need double the CTR of an untargeted campaign just to break even. The implication is straightforward:
- Inaccurate data hurts narrow segments more than broad ones, driving up CPMs and suppressing CTRs
- Verified engagement data — not just impression volume — is the more reliable signal
- Work with publishers or platforms that can confirm audience quality, not just reach
Connect Data Insights Across Channels and Campaigns
Learnings from one campaign (for example, which ad copy drove the highest CTR on email) should inform other channels (social, paid search, display). Cross-channel data sharing reduces the learning curve and compounds performance improvements over time.
Treated in isolation, each channel relearns lessons others have already solved. Applied together, these five practices close the gap between data collection and decisions that actually move spend in the right direction.
How to Measure the Performance of Data-Driven Campaigns
Core Metrics Every Advertiser Should Track
Click-Through Rate (CTR):
Percentage of people who clicked your ad after seeing it. Reveals ad relevance and creative effectiveness.
Return on Ad Spend (ROAS):
Total revenue generated divided by ad spend. A 3x ROAS means $3 earned per $1 spent. Benchmarks vary by industry and margin.
Cost Per Acquisition (CAC):
Total ad spend divided by number of conversions. Lower CAC indicates more efficient targeting and messaging.
Conversion Rate:
Percentage of clicks that result in a desired action. Reveals landing page effectiveness and offer strength.
Customer Lifetime Value (CLV):
Total revenue a customer generates over their relationship with your brand. Essential for calculating acceptable CAC.
Attribution Models and Why They Matter
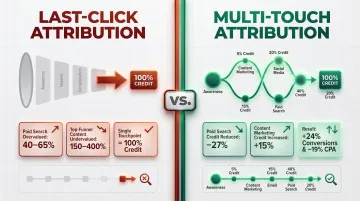
Last-Click Attribution:
Gives 100% credit to the final ad interaction. It consistently undervalues upper-funnel and assist touchpoints.
Multi-Touch Attribution (MTA):
Distributes credit based on actual contribution across the conversion path using AI. This gives a far clearer picture of which channels are driving decisions — not just which one closed them.
The difference in budget decisions can be significant. An $800K marketing budget case study found that switching from last-click to U-shaped multi-touch attribution reduced paid search credit by 27% and increased content marketing credit by 15%. Reallocating spend based on those findings increased total conversions by 24% and decreased CPA by 19%.
Paid search is typically overvalued by 40–65% under last-click models, while top-funnel display and content marketing are undervalued by 150–400%.
Real-Time Optimization
Attribution data is only useful if it feeds action. Data-driven campaigns should be treated as living systems, not static launches. Monitoring live performance data lets advertisers adjust bids, swap creatives, reallocate budget, or shift targeting mid-campaign — making measurement an ongoing input, not just a post-campaign report.
In-flight campaign optimizations directly improve ad delivery performance. Reallocating media spend mid-flight to placements with lower Cost Per Completed View (CPCV) reaches more targeted viewers without increasing media costs.
Incrementality experiments — such as Conversion Lift — divide audiences into test and control groups to measure the causal, incremental impact of ads, providing a more accurate picture than standard attribution.
Frequently Asked Questions
What is data-driven advertising?
Data-driven advertising is the practice of using customer data—behavioral, demographic, and intent-based—to make informed decisions about targeting, ad placement, messaging, and timing. It contrasts with broad, assumption-based campaign approaches by prioritizing precision and relevance over reach.
How do companies use data to create marketing campaigns?
Companies collect data from their own channels (first-party), partners, and public sources, then use it to segment audiences, personalize messaging, select channels, and optimize campaigns in real time. The result is targeting based on actual customer behavior rather than assumptions, which drives higher conversion rates.
How do you measure ad performance?
Ad performance is measured through key metrics including CTR, ROAS, conversion rate, and CAC. Measurement should include attribution modeling to understand which touchpoints drove conversions, alongside real-time monitoring to enable mid-campaign adjustments based on live performance data.
What does 3X ROAS mean?
ROAS (Return on Ad Spend) is total revenue generated divided by ad spend. A 3X ROAS means the campaign generated $3 in revenue for every $1 spent. A "good" ROAS benchmark depends on your industry, profit margins, and campaign objective, so there is no single universal threshold.
What is the 40-40-20 rule in marketing?
The 40-40-20 rule states that 40% of campaign success is attributed to audience targeting, 40% to the offer, and 20% to creative. Creative quality matters, but getting the audience and offer right first is what determines whether a campaign works.
What are the 4 types of data in advertising?
The four types are first-party (your own data from website, CRM, purchases), second-party (partner data shared directly), third-party (purchased/external aggregated data), and behavioral/intent data (search queries, content consumed, engagement signals). First-party and intent data tend to be the most reliable because they reflect real actions taken by real people in your audience.