

Most advertisers default to impressions as their proof point. That's a mistake. Sponsored content in newsletters operates on different terms than web banners or social ads. The inbox is an active environment where readers have chosen to be. That changes what every metric means.
This guide covers the full measurement stack — from open rates and CTR to brand recall and audience intent signals — and explains how to use that data to make smarter campaign decisions, not just cleaner reports.
Key Takeaways
- Engagement depth (clicks, read time, scroll behavior) tells you more than raw impressions ever will.
- Newsletter sponsorships reach inboxes directly — no algorithms, no ad blockers, no feed competition.
- Track four metric categories: reach and visibility, engagement quality, audience demographics, and brand impact.
- Set benchmarks before launch and use mid-campaign data to adjust in real time.
Why Sponsored Content Metrics Are Different
Display advertising is built around exposure. The logic is simple: more eyeballs, more outcomes. Sponsored content doesn't work that way. The goal is attention and trust, which means a metric like impressions alone tells you nothing about whether the campaign succeeded.
Newsletter-based sponsored content operates in a different environment. When a reader opens an email, they're in an active, focused state — they chose to be there. According to Nielsen Norman Group research, readers allocate an average of 51 seconds to a newsletter after opening and fully read only 19% of newsletters. That limited attention window makes every placement more concentrated — and every metric more meaningful — than a passive web impression.
Newsletter placements are also less exposed to browser-based ad blocking than web display inventory. eMarketer data from YouGov shows that 45% of US consumers have installed or used an ad blocker. Newsletter sponsorships don't rely on browser-rendered display slots, so they're less vulnerable to ad blocking by design.
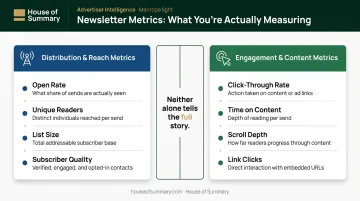
That structural difference shapes how you should think about measurement. Two categories of metrics matter here:
- Distribution/reach metrics — who was exposed to the content
- Engagement/content metrics — what readers did with it
Neither category alone gives you a complete picture. A high open rate with zero clicks indicates a headline problem. Strong clicks with a mismatched audience indicates a targeting problem. Used together, they show not just whether people saw the content — but whether the right people acted on it.
Reach and Visibility Metrics: The Starting Point
Open Rate
Open rate is the first gate for newsletter-based sponsored content. It determines how many subscribers were even in a position to see your placement. If a newsletter doesn't get opened, the sponsored content inside it doesn't exist for that reader.
Mailchimp's December 2023 benchmarks — drawn from campaigns with at least 1,000 subscribers and tracking enabled — put the all-industry average open rate at 35.63%, with Business and Finance at 31.35%. HubSpot's 2025 data reports B2B Services at 39.48%. Both sources note that Apple Mail Privacy Protection can inflate open rates by approximately 18 percentage points.
Treat open rate as a directional signal, not a definitive reach figure. Evaluate it alongside click data and publisher methodology before drawing any conclusions.
Unique Readers vs. Total Impressions
These two figures are frequently conflated and shouldn't be.
| Metric | What It Counts |
|---|---|
| Total impressions | Every time content loaded, including repeat opens by the same reader |
| Unique readers | Individual people who actually saw the content |
For advertisers focused on true reach, unique readers is the number that matters. A newsletter with 50,000 sends and 40% opens reaches roughly 20,000 unique people — not however many total impression events the server logged.
Subscriber Quality Over List Size
Once you know how many unique readers a newsletter reaches, the next question is who those readers actually are. A smaller list of high-intent readers consistently outperforms a larger, disengaged one. Paved's newsletter sponsorship guidance defines a healthy newsletter as maintaining an open rate above 25%, total CTR above 2%, and an unsubscribe rate below 0.3%. These thresholds describe engagement quality, not just scale.
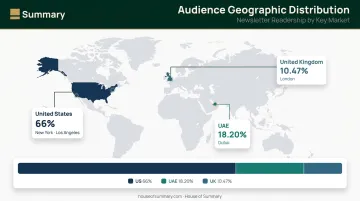
House of Summary's network illustrates this principle. Across 500,000+ subscribers with 254,866+ emails opened daily, the audience skews executive — C-suite leaders, founders, policy professionals, and high-net-worth individuals, with 66% concentrated in the US (primarily New York and Los Angeles). For advertisers targeting decision-makers, that concentration means placements land in front of people with budget authority — not just inboxes.
Engagement Metrics: Where Real Value Is Measured
Click-Through Rate
CTR measures the percentage of readers who clicked at least one link within the sponsored content. It's the clearest signal of whether the content prompted action.
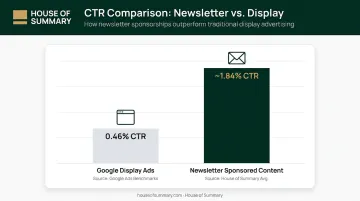
Newsletter sponsored content consistently outperforms web display on CTR. WordStream's analysis of Google Display campaigns puts average display CTR at 0.46% — newsletter environments, where readers are actively engaged and free from competing ad clutter, tend to perform well above that threshold.
That said, CTR varies significantly by placement position, link count, and creative quality. Always request historical ad CTR data by placement from any publisher before making comparative claims.
House of Summary notes CTRs 4x higher than Google AdWords as part of their advertiser value proposition, reflecting the attention advantage of the inbox environment over passive display exposure.
Time on Content and Engaged Reads
Opens confirm delivery. Time on content tells you whether the message actually landed.
An "engaged read" typically means a reader spent enough time with the content to absorb the core message — not just scroll past. What qualifies varies by content length: a 300-word sponsored piece and a 900-word native feature require different benchmarks. The key is comparing average reading time against expected consumption time for that specific piece.
Short read times on longer content signal one of two problems: a weak opening that fails to earn continued attention, or a format mismatch with how readers engage on that device.
Scroll Depth
Scroll depth tracking shows where readers drop off within the sponsored content. For shorter placements, this data is directional. For longer native features, it's essential — it tells you precisely where the headline promise stopped holding.
Where drop-off occurs points to specific problems:
- Early drop-off — introduction isn't earning continued attention
- Drop-off before the CTA — a persuasion gap in the middle of the content
In-Content Link and Conversion Tracking
Scroll depth shows where readers stopped. Link-level tracking shows what moved the ones who continued. Breaking down which specific links drove clicks — product pages, landing pages, sign-up forms — tells you which message elements resonated and which didn't.
Extend that tracking further by appending UTM parameters to destination URLs. This connects newsletter reads to downstream outcomes: purchases, form submissions, content downloads. House of Summary supports tracking links and UTM parameters for advertisers, which closes the attribution loop between newsletter exposure and measurable business outcomes.
Audience Quality Metrics: Who You're Actually Reaching
Numbers without context mislead. A campaign reaching 5,000 relevant decision-makers delivers more commercial value than one reaching 50,000 broadly unqualified readers. Audience quality metrics answer the question that raw reach data can't: were those the right people?
Demographics and Geographic Alignment
Key audience data points to request from any publisher:
- Professional role and seniority — are readers decision-makers or general consumers?
- Geographic concentration — does click activity align with your target markets?
- Gender distribution — does the audience composition match campaign targeting?
House of Summary shares geographic distribution data across its network: 66% US-based (concentrated in New York and Los Angeles), 18.20% UAE (Dubai), and 10.47% UK (London). For a brand targeting US executives or UAE business operators, this alignment check is the difference between a well-placed campaign and wasted spend.
Device Behavior
Desktop and mobile readers engage differently with newsletter content. If mobile readers drop off faster than desktop readers, the layout likely needs reformatting. Common fixes include:
- Tightening copy for smaller screens
- Moving CTAs higher in the piece
- Simplifying link structures for thumb navigation
Audience Intent Signals
Readers who actively subscribe to a specialized, curated newsletter behave differently than passive social media scrollers. They opted in. They return regularly. Their engagement history reflects genuine content interest, not accidental exposure.
A 2022 academic study published by PMC found that list segmentation had a measurable positive effect on open engagement, while sending frequency had the largest negative impact. A targeted, well-managed subscriber list outperforms a high-volume, under-segmented one.
Brand Impact Metrics: The Long Game
Not every sponsored content campaign is optimized for immediate clicks. For many brands — particularly those in luxury, finance, or category education — awareness and perception shift are the primary goals. Different goals require different metrics.
Brand Recall
Brand recall surveys measure whether readers remember the brand after exposure, capturing impact that click data never will. Nielsen's 2023 analysis found branded content achieved 81% aided recall and 63% unaided recall — strong evidence that content-led advertising builds lasting brand memory, not just momentary exposure.
Native and sponsored formats consistently outperform display on attention and purchase intent. Display can hold an advantage on immediate brand recall in certain contexts — which is why the two formats serve different roles in a well-structured campaign.
Sentiment and Downstream Signals
Recall tells you whether the audience remembered the brand. Sentiment tells you how they felt about it. Post-campaign monitoring of social mentions, community responses, and audience reactions reveals whether the content generated positive associations or simply neutral awareness.
Secondary signals to track in the weeks following a campaign:
- Spikes in direct website traffic
- Increases in branded search volume
- Growth in social following or newsletter subscriptions
These signals are harder to attribute directly but provide supporting evidence that the content had impact beyond the click data.
How to Use Metrics to Improve Future Campaigns
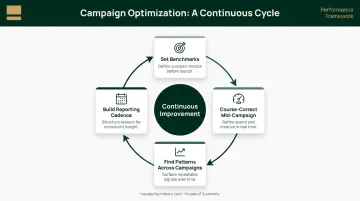
Set Benchmarks Before You Launch
Meaningful measurement starts before a campaign goes live. Agreeing on KPIs with the publisher upfront — open rate thresholds, CTR targets, desired conversion events — creates a shared definition of success and eliminates ambiguity in post-campaign conversations.
Course-Correct Mid-Campaign
Real-time or near-real-time metric access lets both parties identify underperformance while there's still time to act. A low CTR in the first few days often signals a headline or CTA problem that can be adjusted before the full campaign run concludes.
Find Patterns Across Campaigns
A single campaign tells you what happened. Several campaigns tell you what works. After multiple placements, patterns emerge around which topics, formats, and audience segments consistently drive stronger engagement — use those to refine ad creative and placement decisions for future investment.
Build a Clear Reporting Cadence
Before the campaign launches, agree on:
- Frequency — mid-campaign check-in plus a comprehensive final report at minimum
- Format — a unified view of metrics rather than disconnected spreadsheets
- Priority metrics — tied to whether the campaign goal is awareness, consideration, or conversion
This structure keeps both advertiser and publisher aligned — so reporting drives the next decision, not just documents the last one.
Frequently Asked Questions
What are the KPIs for sponsored content?
Core KPIs fall into three categories: reach (open rate, unique readers), engagement (CTR, time on content, scroll depth, specific link clicks), and brand impact (recall, sentiment). The most relevant KPIs depend on whether your campaign goal is awareness, consideration, or direct conversion.
What is a good click-through rate for sponsored newsletter content?
Newsletter CTR benchmarks vary by audience, placement, and creative quality. Web display averages around 0.46% (WordStream). Newsletter sponsorships typically exceed this significantly — request historical ad CTR by placement from the publisher to set realistic, context-specific targets.
How do open rates affect sponsored content performance?
Open rate determines the pool of readers who are even exposed to your placement — it's the first reach gate. A high open rate from an engaged subscriber base amplifies every downstream metric: more opens mean more readers in a position to click, convert, and remember.
What is the difference between impressions and engaged reads?
Impressions indicate the content loaded or was visible. Engaged reads indicate the reader spent meaningful time with it. For brands prioritizing message absorption over raw exposure, engaged reads are the higher-value metric.
How often should advertisers receive performance reports?
At minimum: a mid-campaign check-in to allow for optimization, and a comprehensive final report post-campaign. The reporting cadence, format, and priority metrics should be agreed upon before the campaign launches — not negotiated after it ends.
How do you measure brand awareness from sponsored content?
Brand recall surveys capture memory impact beyond what clicks measure. Secondary indicators include branded search volume changes, direct traffic spikes, social following growth, and sentiment monitoring across social channels in the weeks following the campaign.